
Bitcoin trades near $62.2K, about 6% above Germany’s $57.9K BTC sale average, with 10.46M BTC underwater and RSI near 21.95.
Bitcoin traded near $62,202 on the daily BTC/USD chart, putting it about 6% above Germany’s average sale price.
Germany sold 49,858 BTC for $2.89 billion at an average price of $57,900, and traders are watching whether bears can push Bitcoin below that level.
Germany’s Bitcoin Sale Price Returns to Focus
The German Government sold 49,858 BTC for $2.89 billion, according to the provided transaction details. The average sale price was $57,900 per Bitcoin.
Bitcoin now trades near $62,202, based on the daily chart. A 6% decline from this area would place BTC below Germany’s average sell price.
The German Government sold 49,858 BTC for $2.89B, at an average price of $57,900.
If Bitcoin drops only SIX PERCENT from here
The BTC price will fall below the German Government’s average sell price. pic.twitter.com/6Ubhnl3sxV
— Arkham (@arkham) June 7, 2026
That level has become a market reference point for traders. It is also being compared with current support near $62,000.
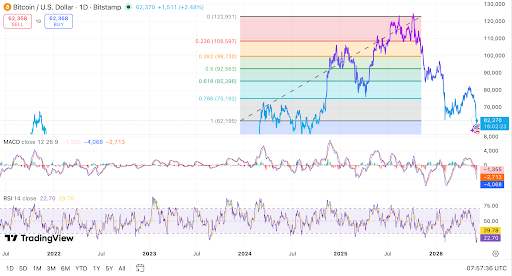
The chart shows Bitcoin near the 1.0 Fibonacci level around $62,195. This area marks the full retracement of the measured rally.
Bitcoin Chart Shows Bearish Daily Structure
The BTC/USD daily chart shows a weak trend after a sharp retracement. Bitcoin has lost several Fibonacci support zones.
The failed levels include $108,597, $99,730, $92,563, $85,396, and $75,192. Each level now serves as potential resistance during any rebound.
The drop below $75,000 was closely watched by traders. That level was the final Fibonacci support before the $62,000 zone.
Bitcoin is now testing support between $62,000 and $62,200. A daily close below this area could keep sellers active.
A relief bounce could target $68,000 to $70,000. Stronger resistance remains near $75,000, where the last breakdown occurred.
Raed Also:
BTC Losing Historic $60K Support Could Spark $1.2B Shock Before Bull Run
Loss Data and Momentum Shape Market View
Market data shared by Ali Charts shows 10.46 million BTC are now held at a loss. Historically, Bitcoin has often formed bottoms when more than 10 million coins were underwater.
This does not confirm a bottom. However, it shows that many holders are now below their entry price.
Historically, Bitcoin has tended to form major bottoms when more than 10 million coins are held at a loss.
That threshold has now been reached, with 10.46 million $BTC currently underwater.
I believe this is an important signal because selling pressure often begins to fade as… https://t.co/DrCgCzTDqF pic.twitter.com/x4VDZx2DFd
— Ali Charts (@alicharts) June 7, 2026
Selling pressure can fade when fewer investors accept realized losses. That pattern is often watched during late-stage declines.
Michael Saylor said, “Bitcoin is an open monetary network for everyone.” The comment framed Bitcoin as part of a wider financial system.
Momentum indicators remain weak on the daily chart. The MACD line is below the signal line and the zero line.
The RSI is near 21.95, placing Bitcoin in oversold territory. This shows stretched selling pressure, but not a confirmed reversal.
A move above RSI 30 could show reduced selling pressure. A stronger recovery would need price to reclaim $70,000 and $75,000.
For now, Bitcoin remains close to a key test. The $57,900 Germany sale price is near if BTC drops another 6%.


Leave a Reply
You must be logged in to post a comment.