- Bitcoin cash is eyeing a fresh increase above the $252 resistance against the US Dollar.
- The price is now trading above the $240 zone and the 55 simple moving average (4 hours).
- There is a key contracting triangle forming with resistance near $250 on the 4-hour chart of the BCH/USD pair (data feed from Coinbase).
- The pair must clear $250 and $252 to start a fresh increase in the near term.
Bitcoin cash price is consolidating gains above $240 against the US Dollar, unlike Bitcoin. BCH/USD could start a fresh surge if it clears the $252 level.
Bitcoin Cash Price Analysis
Bitcoin cash price started a downside correction after it failed to clear the $265 zone. BCH formed a high near $264.950 before there was a bearish move.
The price declined below the $255 and $252 levels. There was a break below the 50% Fib retracement level of the upward move from the $220.12 swing low to the $264.95 high. However, the bulls are protecting more losses below the $240 support zone.
Bitcoin cash is now trading above the $240 zone and the 55 simple moving average (4 hours). On the upside, the price is facing resistance near the $250 level.
There is also a key contracting triangle forming with resistance near $250 on the 4-hour chart of the BCH/USD pair. The next major resistance is near $252, above which the price may perhaps start a strong increase. The next major resistance is near the $256 level. Any more gains above $256 could set the pace for a move toward the $265 level or even $275.
If not, the price might start another decline. Immediate support on the downside is near the $242 level. The first major support sits near the $238 level or the 61.8% Fib retracement level of the upward move from the $220.12 swing low to the $264.95 high. The next major support is near $230, below which the bears might aim for $216.
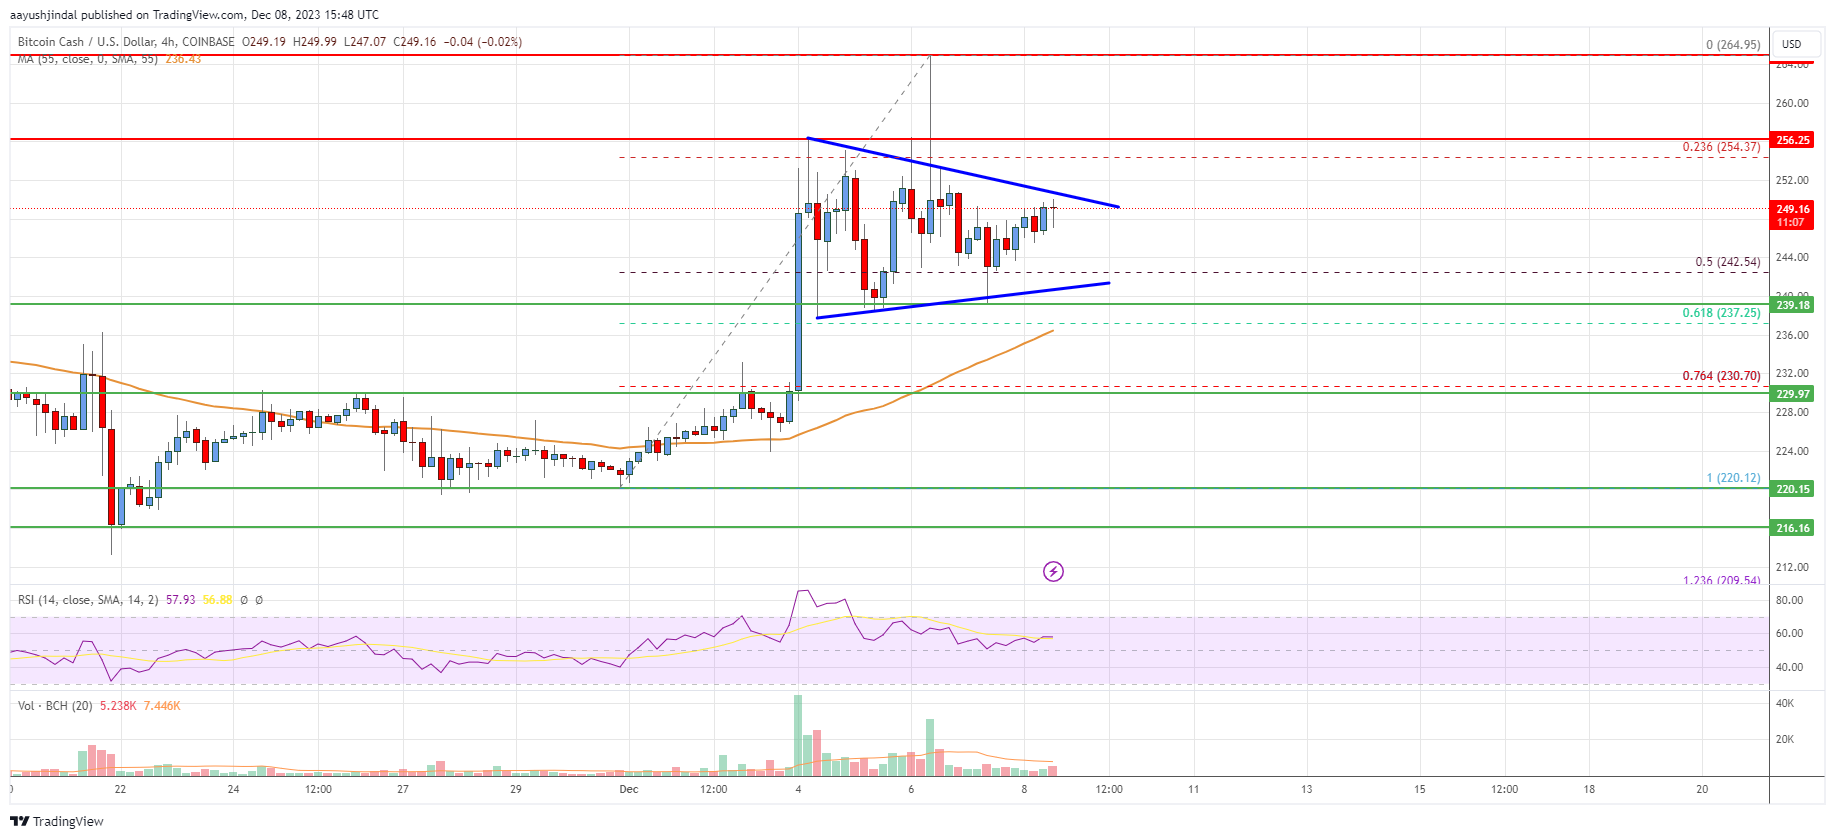
Looking at the chart, Bitcoin Cash’s price is now trading above the $240 zone and the 55 simple moving average (4 hours). Overall, the price must clear $250 and $252 to start a fresh increase in the near term.
Technical indicators
4 hours MACD – The MACD for BCH/USD is gaining pace in the bullish zone.
4 hours RSI (Relative Strength Index) – The RSI for BCH/USD is above the 50 level.
Key Support Levels – $242 and $238.
Key Resistance Levels – $250 and $252.
