
- Bitcoin cash price started a fresh decline from the $322 resistance against the US Dollar.
- The price is now trading below the $312 zone and the 55 simple moving average (4-hours).
- There is a key bearish trend line forming with resistance near $308 on the 4-hours chart of the BCH/USD pair (data feed from Coinbase).
- The pair remains at a risk of a downside break below the $300 support zone in the near term.
Bitcoin cash price is struggling below $312 against the US Dollar, similar to bitcoin. BCH/USD could extend losses if there is a clear move below $295.
Bitcoin Cash Price Analysis
Bitcoin cash price made a few attempts to gain strength above $320 and $322. However, BCH failed to gain pace and started a fresh decline below the $312 level.
There was a move below the $300 level and the 55 simple moving average (4-hours). The price even traded below the $295 support and traded as low as $291. Recently, there was an upside correction above the $298 and $300 levels.
The price climbed above the 50% Fib retracement level of the recent decline from the $322 swing high to $291 low. On the upside, the price is now facing resistance near the $308 level.
There is also a key bearish trend line forming with resistance near $308 on the 4-hours chart of the BCH/USD pair. The next major resistance is near the $312 level and the 55 simple moving average (4-hours). The 76.4% Fib retracement level of the recent decline from the $322 swing high to $291 low is also near $314.
A clear break above $312 and $314 might start a fresh increase. In the stated case, the price could even clear the $320 resistance zone. The next major hurdle is near the $340 level.
An immediate support on the downside is near the $300 zone. The next major support is near the $295 level, below which the bears might gain strength. The next target for them may perhaps be near the $275 level.
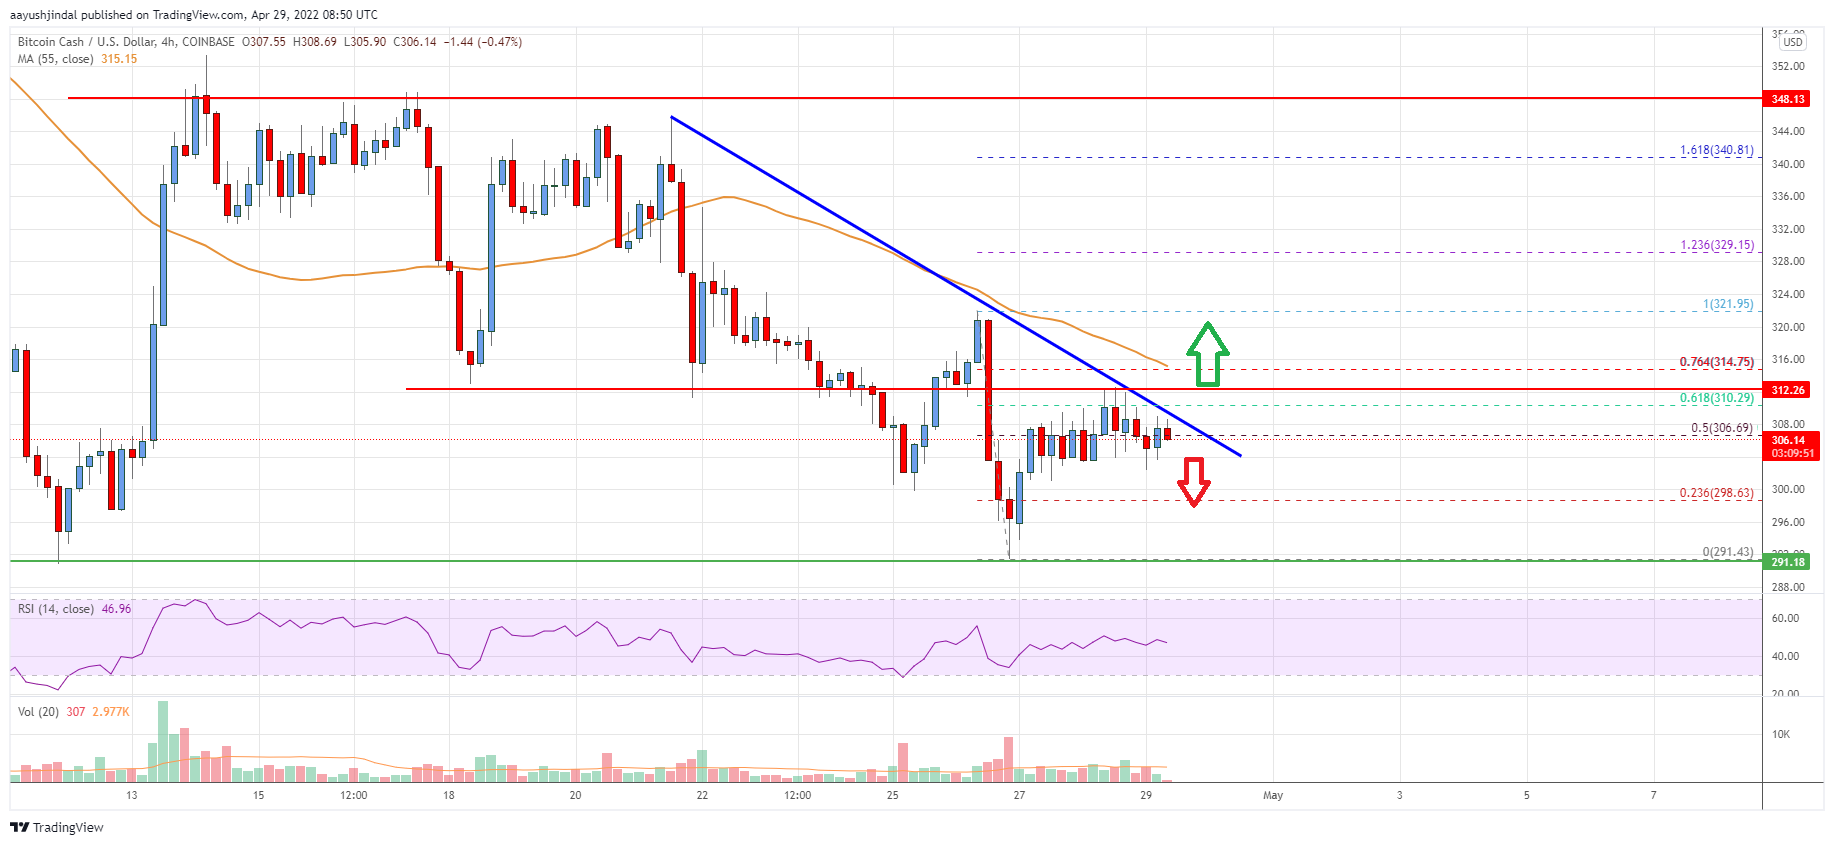
Looking at the chart, bitcoin cash price is now trading below the $312 zone and the 55 simple moving average (4-hours). Overall, the price remains at a risk of a downside break below the $300 support zone in the near term.
Technical indicators
4 hours MACD – The MACD for BCH/USD is slowly losing pace in the bearish zone.
4 hours RSI (Relative Strength Index) – The RSI for BCH/USD is now just below the 50 level.
Key Support Levels – $300 and $295.
Key Resistance Levels – $312 and $320.


Leave a Reply
You must be logged in to post a comment.