
- Bitcoin cash price failed to clear the $320 resistance and corrected lower against the US Dollar.
- The price is now trading below the $300 level and the 55 simple moving average (4-hours).
- There is a major contracting triangle forming with support at $285 on the 4-hours chart of the BCH/USD pair (data feed from Coinbase).
- The pair could decline heavily if there is a clear break below the $285 support zone.
Bitcoin cash price is struggling to stay above $285 against the US Dollar, while bitcoin is well above $19,000. BCH/USD is likely to decline heavily if it breaks the $280-$285 support zone
Bitcoin Cash Price Analysis
After testing the $250 support zone, bitcoin cash price started a decent increase above the $270 and $280 levels. BCH price even broke the $300 resistance and the 55 simple moving average (4-hours).
However, the price struggled to continue higher above $320 and formed a high at $322. Recently, there was a fresh decline below the $305 support. There was a break below the 23.6% Fib retracement level of the upward move from the $251 swing low to $322 high.
It is now trading below the $300 level and the 55 simple moving average (4-hours). It seems like the price is finding it hard to stay above the $285 support.
There is also a major contracting triangle forming with support at $285 on the 4-hours chart of the BCH/USD pair. The triangle support is close to the 50% Fib retracement level of the upward move from the $251 swing low to $322 high.
If there is a downside break below the $285 and $280 support levels, there could be a sharp decline. The next key support is near the $265 level, below which bitcoin cash price is likely to retest the $250 support.
Conversely, the price stays above the $285 support and start a fresh increase. An initial resistance is near the $300 level and triangle upper trend line. A close above the $300 barrier might lead the price towards the $320 and $325 resistance levels in the near term.
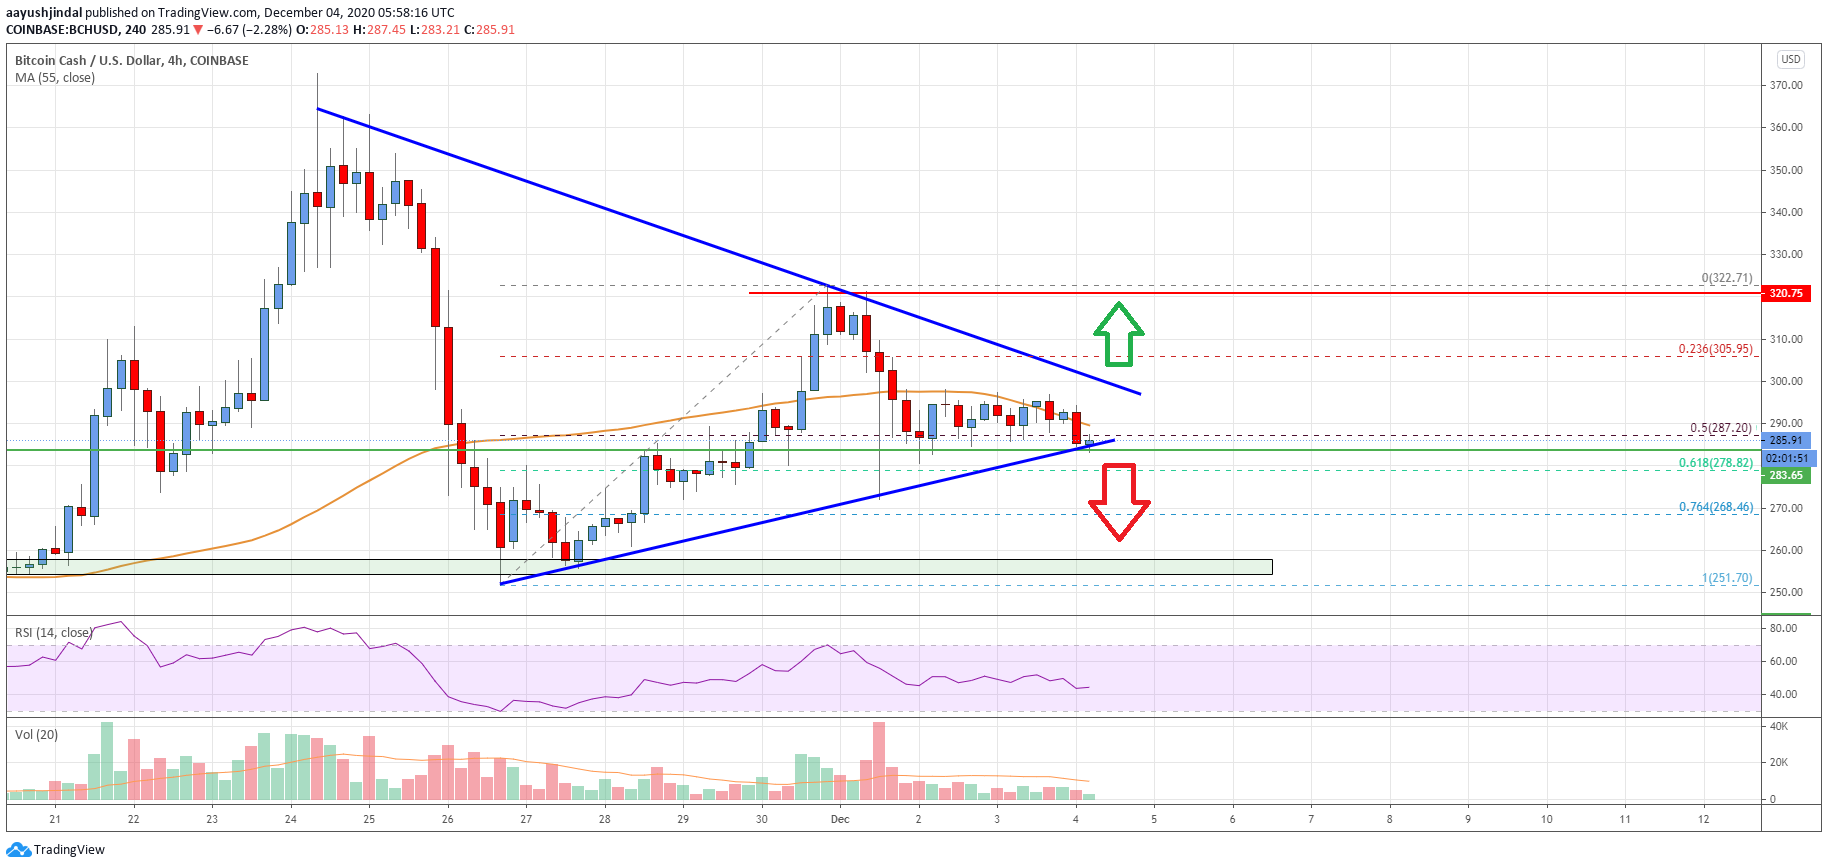
Looking at the chart, bitcoin cash price is struggling to stay above the $285 and $280 support levels. Overall, the price could decline heavily if there is a clear break below the $285 support zone.
Technical indicators
4 hours MACD – The MACD for BCH/USD is slowly gaining pace in the bearish zone.
4 hours RSI (Relative Strength Index) – The RSI for BCH/USD is currently below the 50 level.
Key Support Levels – $285 and $265.
Key Resistance Levels – $300 and $320.


Leave a Reply
You must be logged in to post a comment.