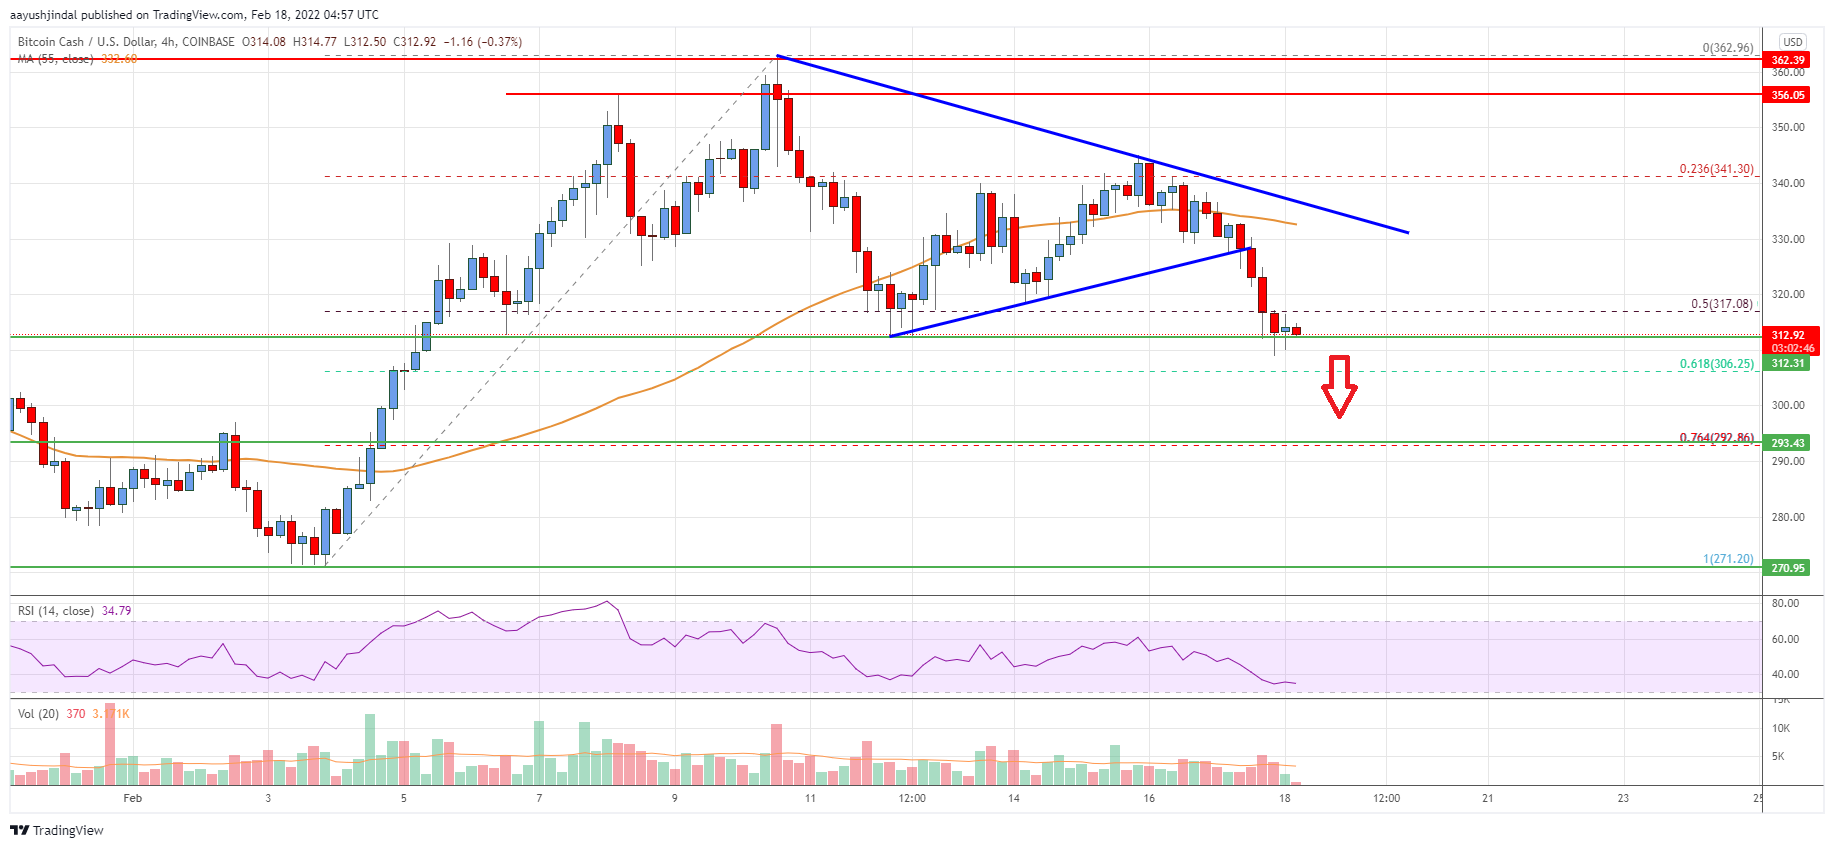
- Bitcoin cash price started a fresh decline from the $360 resistance against the US Dollar.
- The price is now trading below the $330 zone and the 55 simple moving average (4-hours).
- There was a break below a key bullish trend line with support near $328 on the 4-hours chart of the BCH/USD pair (data feed from Coinbase).
- The pair could continue to move down if there is a clear move below $300 in the near term.
Bitcoin cash price is struggling below $330 against the US Dollar, similar to bitcoin. BCH/USD must stay above $300 to avoid more downsides in the near term.
Bitcoin Cash Price Analysis
Bitcoin cash price attempted an upside break above the $350 and $360 resistance levels. However, BCH struggled near the $360 zone and formed a high near $362.
The price started a fresh decline below the $350 support level. There was a break below the 23.6% Fib retracement level of the upward move from the $272 swing low to $362 high. Besides, there was a break below a key bullish trend line with support near $328 on the 4-hours chart of the BCH/USD pair.
The pair traded below the $330 support and the 55 simple moving average (4-hours). It is now consolidating below the 50% Fib retracement level of the upward move from the $272 swing low to $362 high.
It seems like the bulls are protecting the $310 support. The next major support is near the $300 level, below which the bears gain strength. The next target for them may perhaps be near the $280 level. An immediate resistance on the upside is near the $320 level.
The next major resistance is near the $330 level. A clear break above $330 and $332 might start a fresh increase. In the stated case, the price could rise towards the $360 level.

Looking at the chart, bitcoin cash price is now trading below the $330 zone and the 55 simple moving average (4-hours). Overall, the price could continue to move down if there is a clear move below $300 in the near term.
Technical indicators
4 hours MACD – The MACD for BCH/USD is slowly gaining pace in the bearish zone.
4 hours RSI (Relative Strength Index) – The RSI for BCH/USD is now below the 50 level.
Key Support Levels – $310 and $300.
Key Resistance Levels – $320 and $330.


Leave a Reply
You must be logged in to post a comment.