- Bitcoin cash price started a fresh decline below the $115 zone against the US Dollar.
- The price is now trading below the $115 zone and the 55 simple moving average (4 hours).
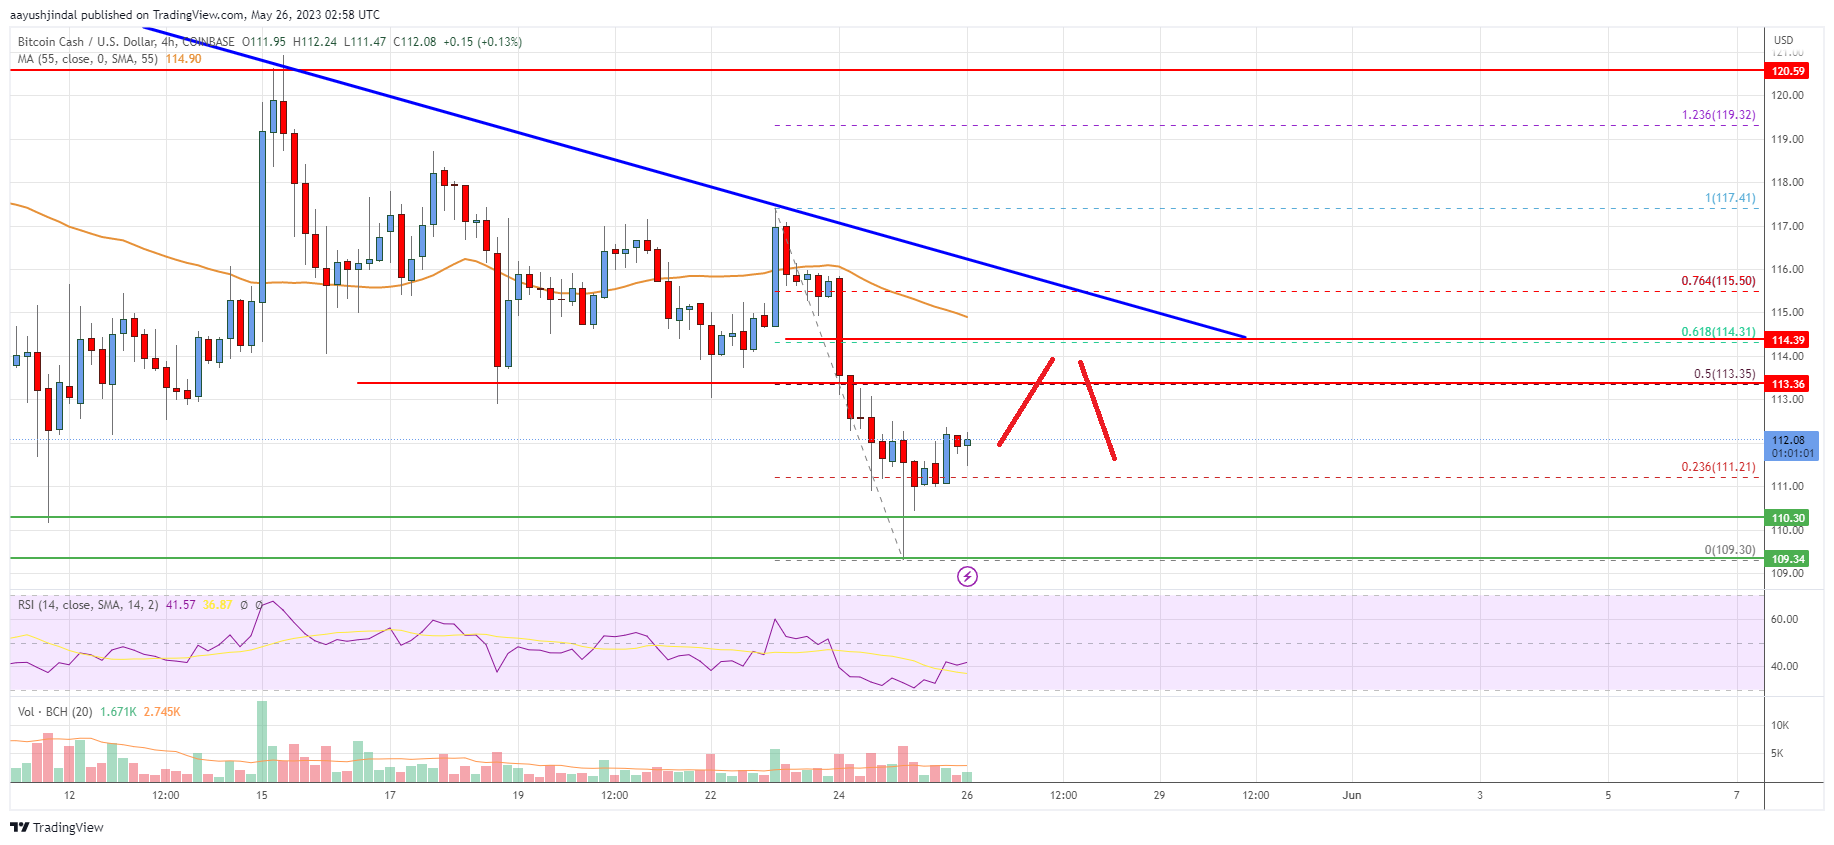
- There is a key bearish trend line forming with resistance near $115 on the 4-hour chart of the BCH/USD pair (data feed from Coinbase).
- The pair could continue to move down if it stays below the $115 resistance zone.
Bitcoin cash price is declining below the $115s zone against the US Dollar, similar to Bitcoin. BCH/USD could extend losses if there is a close below $110.
Bitcoin Cash Price Analysis
Bitcoin cash price struggled to gain pace for a move above the $117 and $118 resistance levels. BCH formed a high near $117.41 and started a fresh decline.
There was a clear move below the $116.00 and $115.00 support levels. The pair even declined below the $112 support. It tested the $110 zone. A low is formed near $109.30 and the price is now consolidating losses. It is now trading above the 23.6% Fib retracement level of the recent decline from the $117.41 swing high to the $109.30 low.
Besides, it is trading below the $115 zone and the 55 simple moving average (4 hours). Immediate resistance is near the $113.50 level.
The 50% Fib retracement level of the recent decline from the $117.41 swing high to the $109.30 low is also near the $113.50 level. The next key resistance is near $115 and the trend line. Any more gains above $115 could set the pace for a move toward the $118 level.
If there is a move above the $118 resistance, the price could rise toward the $122 zone. If not, the price might continue lower below $111.
Immediate support on the downside is near the $110 zone. The next major support is near the $105 level, below which the bears might aim for $100.

Looking at the chart, Bitcoin cash price is now trading below the $115 zone and the 55 simple moving average (4 hours). Overall, the price could continue to move down if it stays below the $115 resistance zone.
Technical indicators
4 hours MACD – The MACD for BCH/USD is losing pace in the bearish zone.
4 hours RSI (Relative Strength Index) – The RSI for BCH/USD is below the 50 level.
Key Support Levels – $110 and $105.
Key Resistance Levels – $115 and $118.


Leave a Reply
You must be logged in to post a comment.