
- Bitcoin cash price is following a bullish path above the $250 level against the US Dollar.
- The price is facing a major hurdle near the $268 and $270 levels.
- There is a major bullish trend line forming with support near $254 on the 4-hours chart of the BCH/USD pair (data feed from Coinbase).
- The pair is likely to accelerate higher if there is a clear break above the $268 resistance zone.
Bitcoin cash price is trading in an uptrend above $255 against the US Dollar. BCH/USD is likely to clear the $270 barrier as long as it is above the $250 pivot level.
Bitcoin Cash Price Analysis
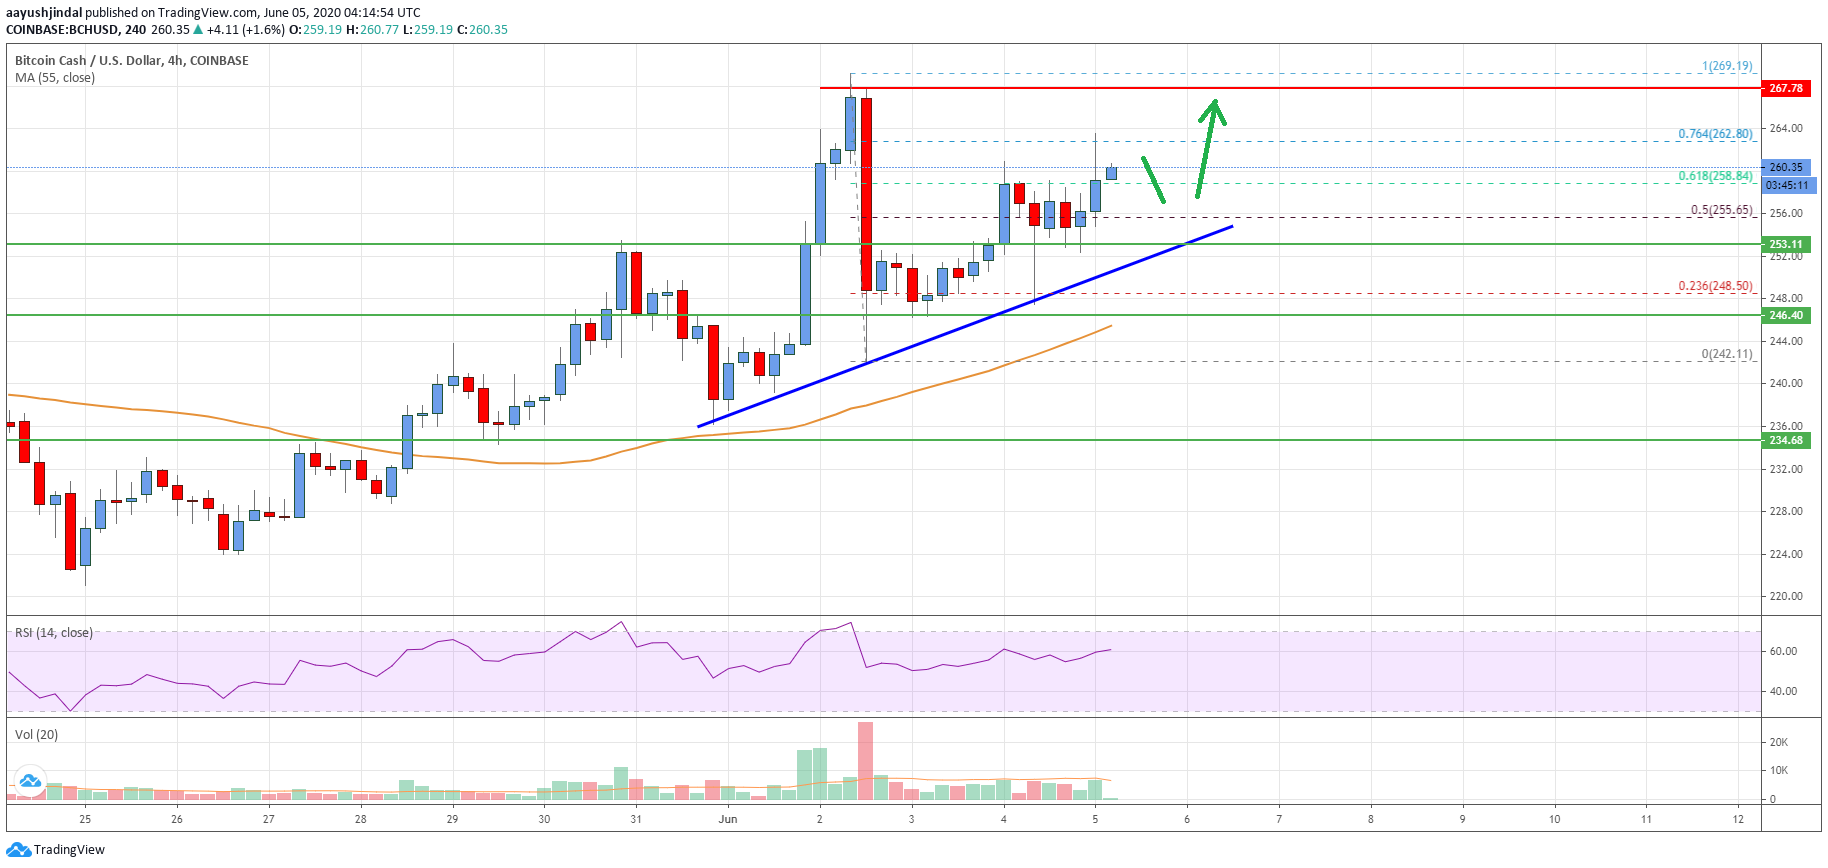
Earlier this week, bitcoin cash price extended its rise above the $260 level against the US Dollar. BCH even traded above the $265 level, but it failed to surpass the $270 resistance zone.
A high was formed near $269 before there was a sharp downside correction. It broke the $255 level and even spiked below the $250 support. However, the price bounced back above $250 and remained well above the 55 simple moving average (4-hours).
It traded above the 50% Fib retracement level of the downward move from the $269 high to $242 low. It is now trading nicely above the $255 level. There is also a major bullish trend line forming with support near $254 on the 4-hours chart of the BCH/USD pair.
On the upside, an initial resistance is near the $262 level. It is close to the 76.4% Fib retracement level of the downward move from the $269 high to $242 low.
The main resistance on the upside is near the $268 and $270 levels. If bitcoin cash price surges above the $270 level, it could extend its rise towards the $280 and $285 levels. The next major resistance is seen near the $300 level.
On the downside, the key support is near the trend line and $255. Any further losses may put the $250 support at risk. The next major support is seen near the $245 level and the 55 SMA.
Looking at the chart, bitcoin cash price is clearly trading in a positive zone above the $255 level. As long as there is no close below the $250 support, the price is likely to accelerate higher above the $270 level.
Technical indicators
4 hours MACD – The MACD for BCH/USD is currently gaining momentum in the bullish zone.
4 hours RSI (Relative Strength Index) – The RSI for BCH/USD is now well above the 50 level.
Key Support Levels – $255 and $250.
Key Resistance Levels – $262 and $270.


Leave a Reply
You must be logged in to post a comment.