
- Bitcoin cash price started another decline after it failed near the $255 resistance against the US Dollar.
- The price declined below the key $240 and $230 support levels.
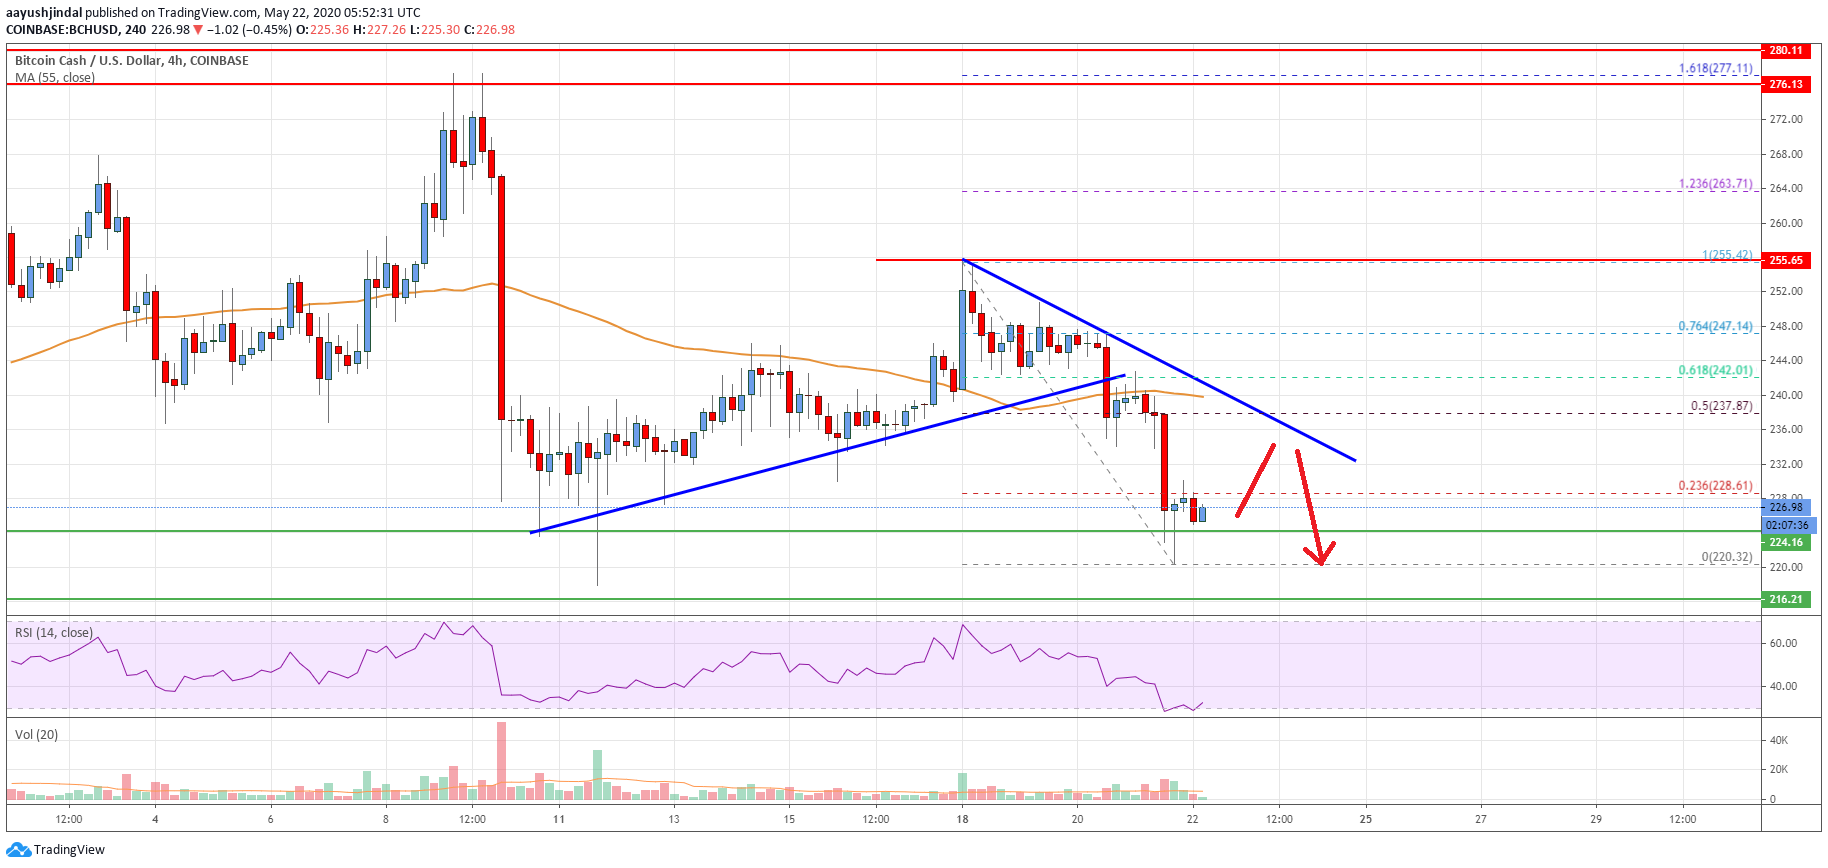
- There is a major bearish trend line forming with resistance near $235 on the 4-hours chart of the BCH/USD pair (data feed from Coinbase).
- The pair could correct higher a few points, but it is likely to face hurdles near $235 and $240.
Bitcoin cash price is back in a bearish zone below $240 against the US Dollar. BCH/USD must stay above the $220 support to avoid more losses in the near term.
Bitcoin Cash Price Analysis
In the past few days, bitcoin cash price faced an increase in selling pressure above $250 against the US Dollar. As a result, BCH started another decline after it failed near the $255 resistance.
There was a break below the $250 and $240 levels. The price even broke the $230 support and the 55 simple moving average (4-hours). During the decline, there was a break below a key bullish trend line with support at $242 on the 4-hours chart of the BCH/USD pair.
The pair traded as low $220 and it is currently consolidating above the $222 support. It is facing hurdles near the $228 level. The stated level is close to the 23.6% Fib retracement level of the recent decline from the $255 high to $220 low.
On the upside, there is a major resistance forming near the $235 and $240 levels. Besides, there is a major bearish trend line forming with resistance near $235 on the same chart.
The trend line coincides with the 50% Fib retracement level of the recent decline from the $255 high to $220 low. The 55 simple moving average (4-hours) is also near the $240 resistance zone.
Therefore, if there is an upside correction towards the $235 and $240 levels, the bears are likely to remain active. On the downside, the $222 and $220 levels are important supports.
If there is a clear break below the $220 support, there is a risk of a larger decline in the coming sessions. The next major support is seen near the $200 level.
Looking at the chart, bitcoin cash price is clearly back in a bearish zone below the $240 level. If the bulls fail to defend the $220 support, the price may perhaps revisit the $200 support.
Technical indicators
4 hours MACD – The MACD for BCH/USD is currently losing momentum in the bearish zone.
4 hours RSI (Relative Strength Index) – The RSI for BCH/USD is correcting higher from the 20 level.
Key Support Levels – $220 and $200.
Key Resistance Levels – $235 and $240.


Leave a Reply
You must be logged in to post a comment.