- Bitcoin cash price extended declines recently and broke the $140 support level against the US Dollar.
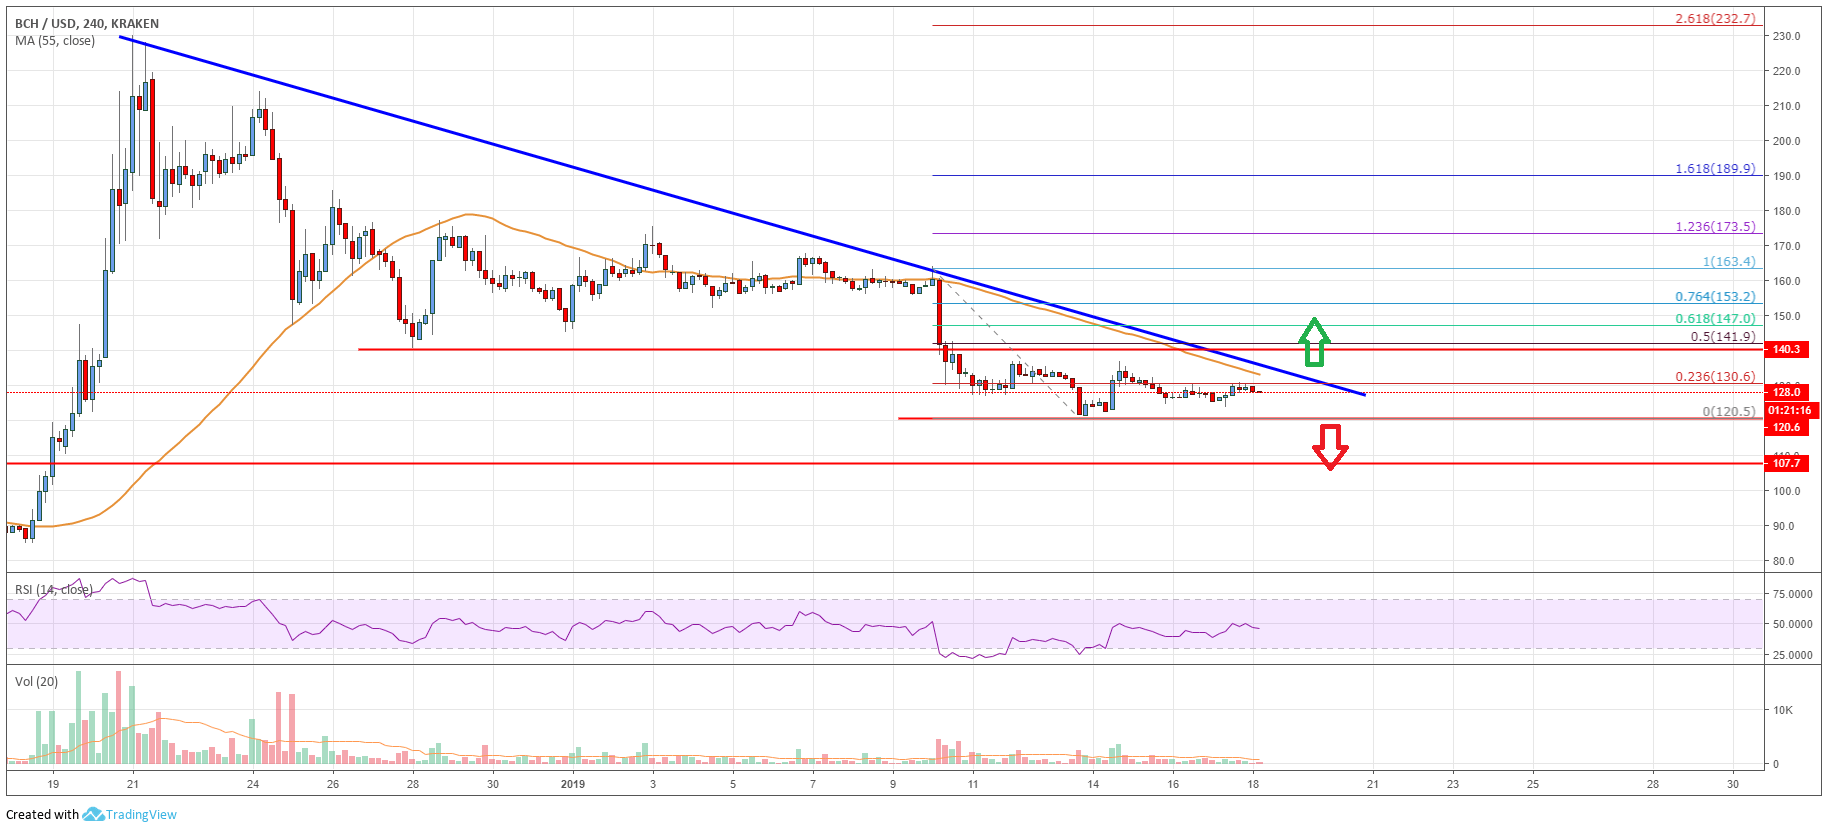
- There is a crucial bearish trend line in place with resistance at $135 on the 4-hours chart of the BCH/USD pair (data feed from Kraken).
- The pair is positioned for the next major move either above $135 or below $120 in the near term.
Bitcoin cash price traded below the $150 and $140 supports against the US Dollar. BCH is now looking for the next key break either above $135-140 or towards $100 in the near term.
Bitcoin Cash Price Analysis
Recently, bitcoin and Ethereum faced an increased selling pressure, which dragged bitcoin cash price below $140 against the US Dollar. The BCH/USD pair formed a high near the $163 level and later declined steadily below $150. It broke the $140 and $135 support levels to move into a bearish zone. The price tested the $120 support, where buyers emerged and protected losses. A low was formed near $120.5 and later the price started consolidating losses. It corrected a few points above the $125 and $127 levels.
There was also a break above the 23.6% Fib retracement level of the recent decline from the $163 high to $120 low. However, buyers failed to hold gains above $130 and there was no test of the 55 simple moving average (4-hours). The price trimmed gains and it is currently trading well below $130. More importantly, there is a crucial bearish trend line in place with resistance at $135 on the 4-hours chart of the BCH/USD pair. A proper break above the trend line could open the doors for more gains. The next key resistance is $140 and the 50% Fib retracement level of the recent decline from the $163 high to $120 low.

Looking at the chart, bitcoin cash price is clearly positioned for the next major move either above $135 or below $120. If there is a downside break below $120, the price may test the $100 support.
Technical indicators
4-hours MACD – The MACD for BCH/USD is currently flat in the bearish zone.
4-hours RSI (Relative Strength Index) – The RSI for BCH/USD is struggling to move above the 50 level.
Key Support Level – $130
Key Resistance Level – $120


Leave a Reply
You must be logged in to post a comment.