- Ethereum price corrected higher after testing the $113.114 support area against the US Dollar.
- ETH is heading towards a major bearish trend line with resistance at $135 on the 4-hours chart (data feed from Coinbase).
- The price may struggle to surpass the $132, $135 and $138 resistance levels in the near term.
Ethereum price gained traction above the $120 barrier and rallied above $126 against the US Dollar. However, ETH is likely to fail near the $135-138 resistance zone.
Ethereum Price Analysis
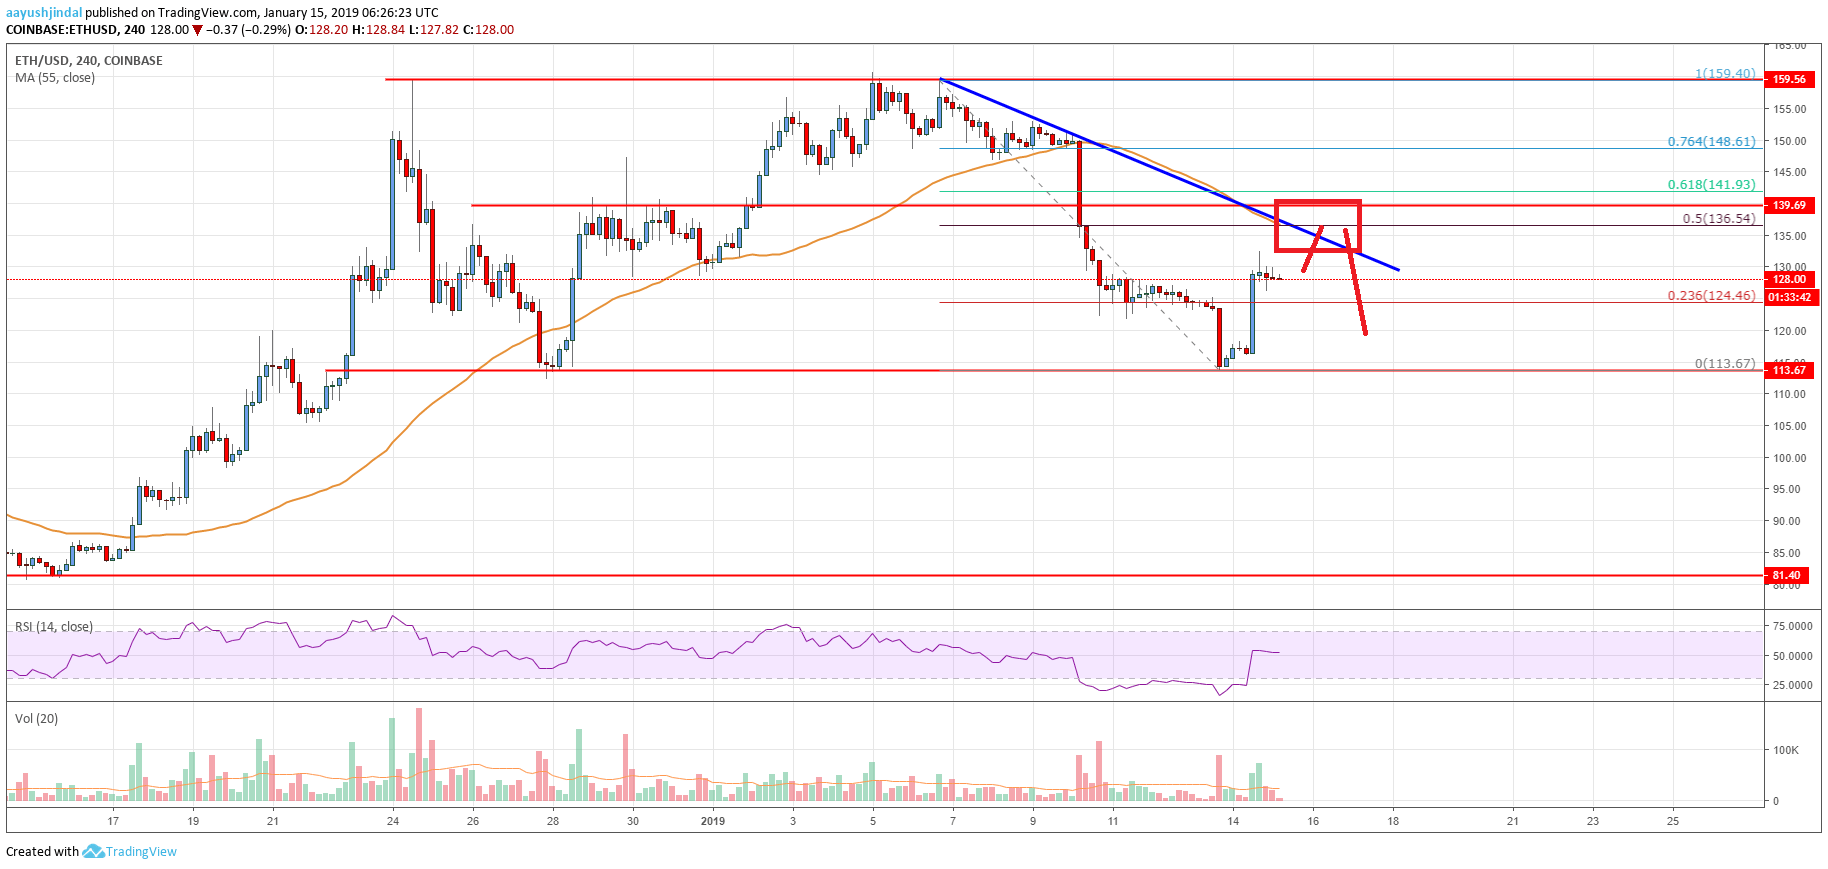
This past week, we saw a significant decline in Ethereum price from the $159.40 swing high against the US Dollar. The ETH/USD pair declined heavily and broke the $150.00, $142.00 and $124.00 support levels. There was even a close below the $136 pivot and the 55 simple moving average (4-hours). Sellers gained traction and pushed the price below the $120.00 support area. A new monthly low was formed at $113.67 and later the price formed a support base.
It seems like $113-114 zone acted as a solid support, resulting in a sharp upside correction. The price moved above the 23.6% Fib retracement level of the last decline from the $159 swing high to $113 swing low. It spiked above the $130 level and moved into a positive zone. At the moment, the price is consolidating below $130, with a few bearish signs. On the upside, there is a strong resistance near $135-138. There is also a major bearish trend line in place with resistance at $135 on the same chart. Besides, the 50% Fib retracement level of the last decline from the $159 swing high to $113 swing low is at $136.

Looking at the chart, Ethereum price is clearly facing a solid resistance near the $135 and $136 levels. A clear break above the $136 level and the 55 simple moving average (4-hours) is needed for more gains. On the downside, the main supports are at $124 and $120.
Technical indicators
4-hours MACD – The MACD for ETH/USD moved back nicely in the bullish zone, with a positive bias.
4-hours RSI (Relative Strength Index) – The RSI for ETH/USD jumped back sharply above the 50 level.
Key Support Level – $124
Key Resistance Level – $136


Leave a Reply
You must be logged in to post a comment.