- Bitcoin cash price topped near the $351 level and declined steadily later against the US Dollar.
- The price broke the key $300 support recently to enter a short term bearish trend.
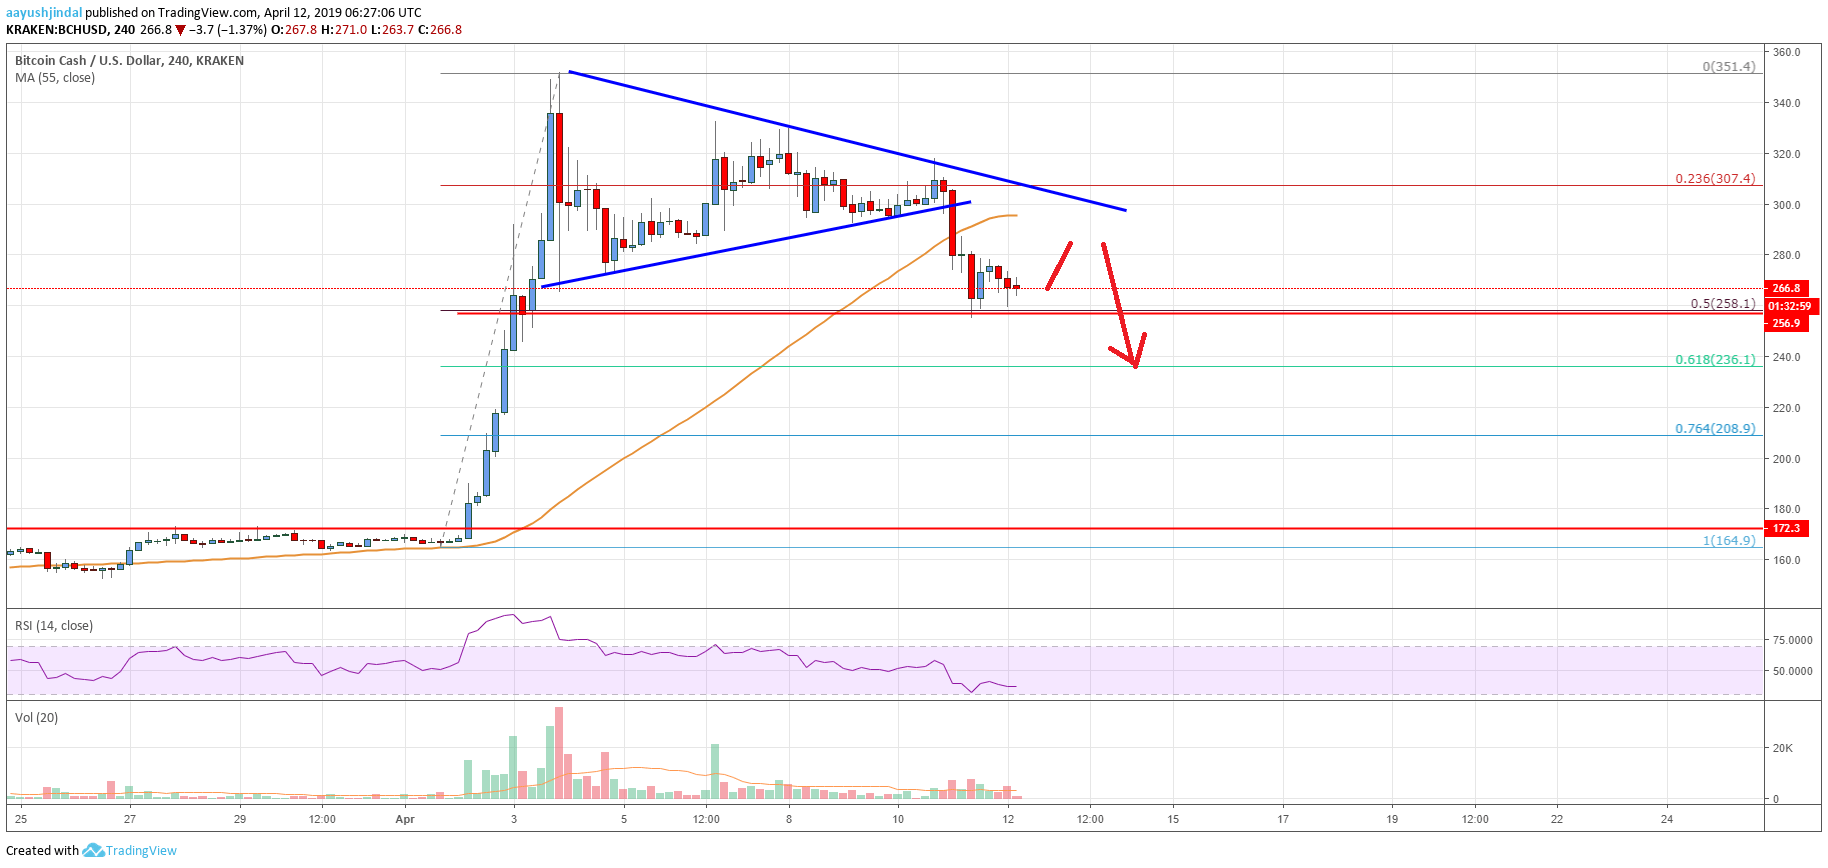
- There was a break below a major contracting triangle with support near $300 on the 4-hours chart of the BCH/USD pair (data feed from Kraken).
- The pair is currently holding the key $260 support and it may recover in the short term.
Bitcoin cash price struggled recently and traded below $300 and $285 against the US Dollar. BCH is currently holding the key $255-260 support and it could bounce back.
Bitcoin Cash Price Analysis
In the past two sessions, there was a sharp decline in bitcoin, ripple, Ethereum, and bitcoin cash against the US Dollar. Earlier, the BCH/USD pair climbed above the $300 level and tested the $350 resistance area. The price traded to a new 2019 high at $351.9 and later started a downside correction. There was a consolidation pattern formed, but sellers had the upper hand and pushed the price below the $300 support area.
There was a break below a major contracting triangle with support near $300 on the 4-hours chart of the BCH/USD pair. The pair even broke the 23.6% Fib retracement level of the last wave from the $165 swing low to $350 swing high. Besides, there was a close below the $285 level and the 55 simple moving average (4-hours). The price even broke the $275 level and tested the next main support near the $260 level. It seems like the 50% Fib retracement level of the last wave from the $165 swing low to $350 swing high acted as a strong support.
The current structure suggests the price may correct higher towards $280 or even $285. However, upsides are likely to remain capped near the $290 and $300 levels. The 55 simple moving average (4-hours) might also act as a strong resistance. On the downside, a break below the $260 support area could push the price towards the $235 support. It represents the 61.8% Fib retracement level of the last wave from the $165 swing low to $350 swing high.

Looking at the chart, bitcoin cash price clearly struggled recently and settled below the $285 support. In the short term, there could be an upside correction, but sellers are likely to protect $290 or $300. On the downside, the main supports are $260, $258 and $235.
Technical indicators
4 hours MACD – The MACD for BCH/USD is currently placed in the bearish zone.
4 hours RSI (Relative Strength Index) – The RSI for BCH/USD declined sharply and now well below the 50 level.
Key Support Levels – $260 and $235.
Key Resistance Levels – $290 and $300.


Leave a Reply
You must be logged in to post a comment.