- Ripple price climbed higher this past week towards the $0.3800 resistance area against the US dollar.
- The price traded as high as $0.3850 and recently corrected lower below $0.3700.
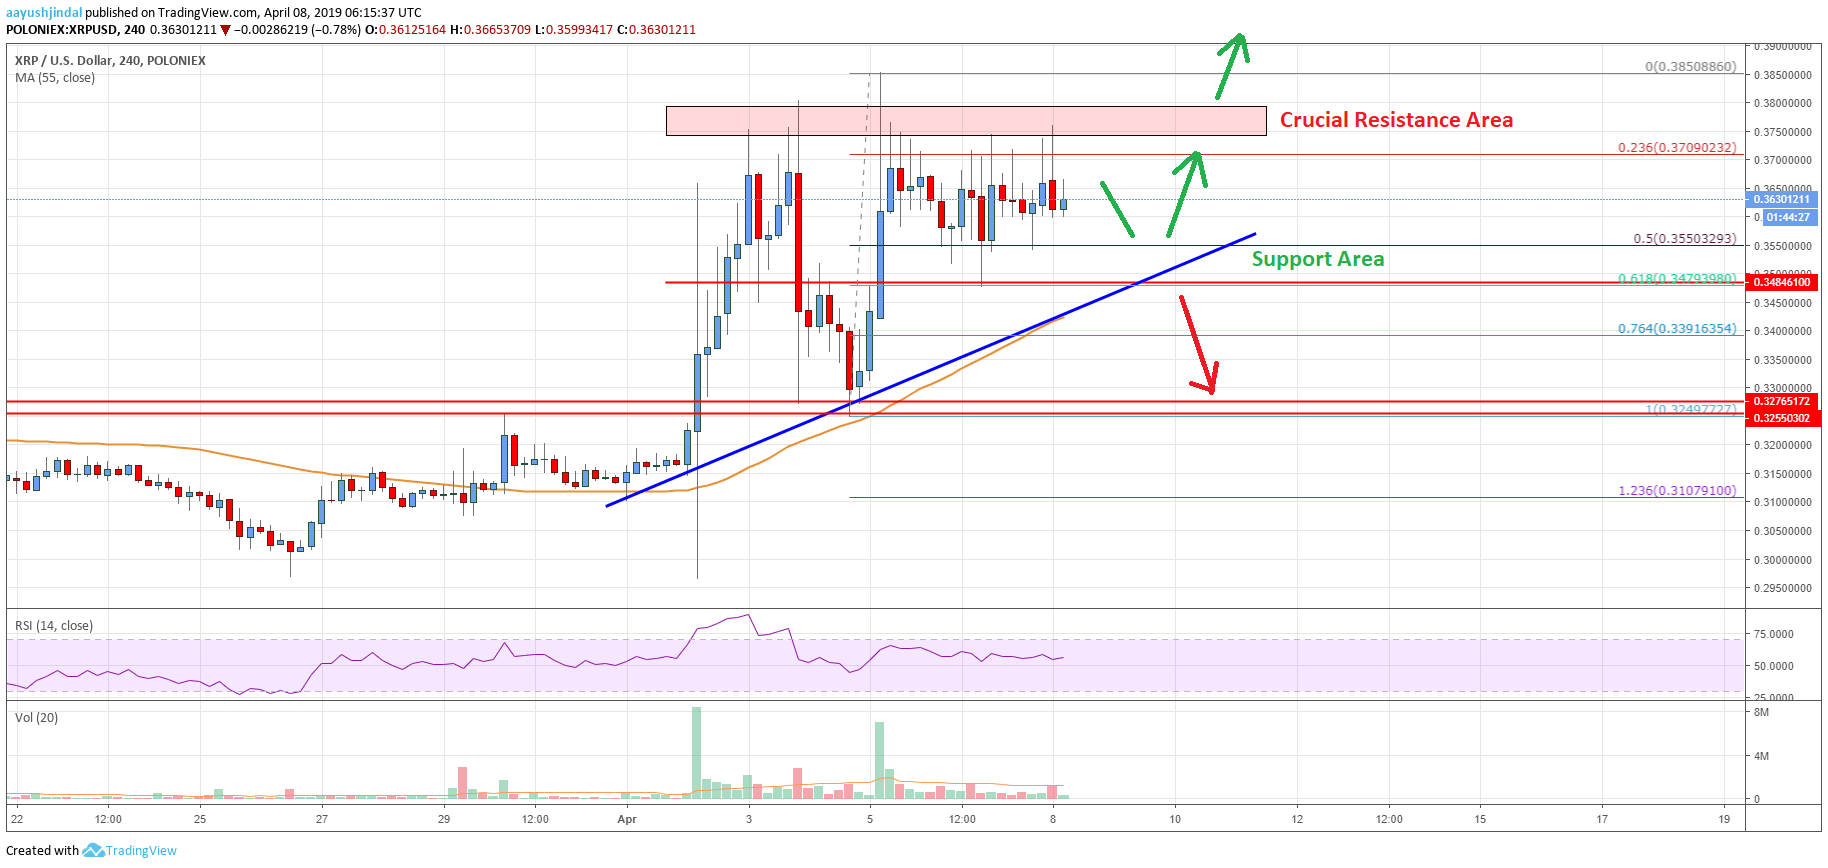
- There is a crucial bullish trend line in place with support at $0.3480 on the 4-hours chart of the XRP/USD pair (data source from Poloniex).
- The price is likely to surge higher once it clears the $0.3800 and $0.3850 resistance levels.
Ripple price is consolidating above the $0.3500 support area against the US Dollar. XRP might start a significant upward move towards $0.4000 once it clears the $0.3850 resistance.
Ripple Price Analysis
This past week, there was a short term downside correction in bitcoin, Ethereum, bitcoin cash, ADA and ripple against the US Dollar. Earlier, the XRP/USD pair started a solid upward move and climbed higher from the $0.3000 support area. It broke the $0.3250 and $0.3280 resistance levels to move into a positive zone. Finally, buyers gained control and pushed the price above the $0.3550 and $0.3620 resistance levels. The price rallied towards the $0.3800 level and settled above the 55 simple moving average (4-hours).
Later, there was a downside correction, but the price found support near $0.3280. There was a fresh rally and the price traded to a new yearly high at $0.3850. However, the price failed to stay above the $0.3800 level and recently corrected below $0.3700. There was even a break below the 50% Fib retracement level of the last wave from the $0.3249 low to $0.3850 high.
To the downside, there is a strong support formed near $0.3500. The recent drop was protected by the 61.8% Fib retracement level of the last wave from the $0.3249 low to $0.3850 high. There is also a crucial bullish trend line in place with support at $0.3480 on the 4-hours chart of the XRP/USD pair. The pair is currently trading with a positive bias below the $0.3800 resistance area. Buyers need to clear the $0.3800 and $0.3850 resistances for more upsides in the near term.

Looking at the chart, ripple price seems to be setting up for the next significant break either above $0.3800 or below $0.3500. To the upside, a clear break above the $0.3850 is likely to push the price towards the $0.4000 level. The next key resistance above $0.4000 is near $0.4120. Conversely, a downside break below $0.3500 might push the price back towards $0.3280.
Technical indicators
4 hours MACD – The MACD for XRP/USD is currently flat in the bullish zone.
4 hours RSI (Relative Strength Index) – The RSI for XRP/USD is currently placed nicely above the 50 level.
Key Support Levels – $0.3600, $0.3550 and $0.3500.
Key Resistance Levels – $0.3800 and $0.3850.


Leave a Reply
You must be logged in to post a comment.