- Bitcoin price rallied sharply after it broke the $4,200 and $4,220 resistances against the US Dollar.
- The price climbed more than 25% and broke the $5,000 resistance level.
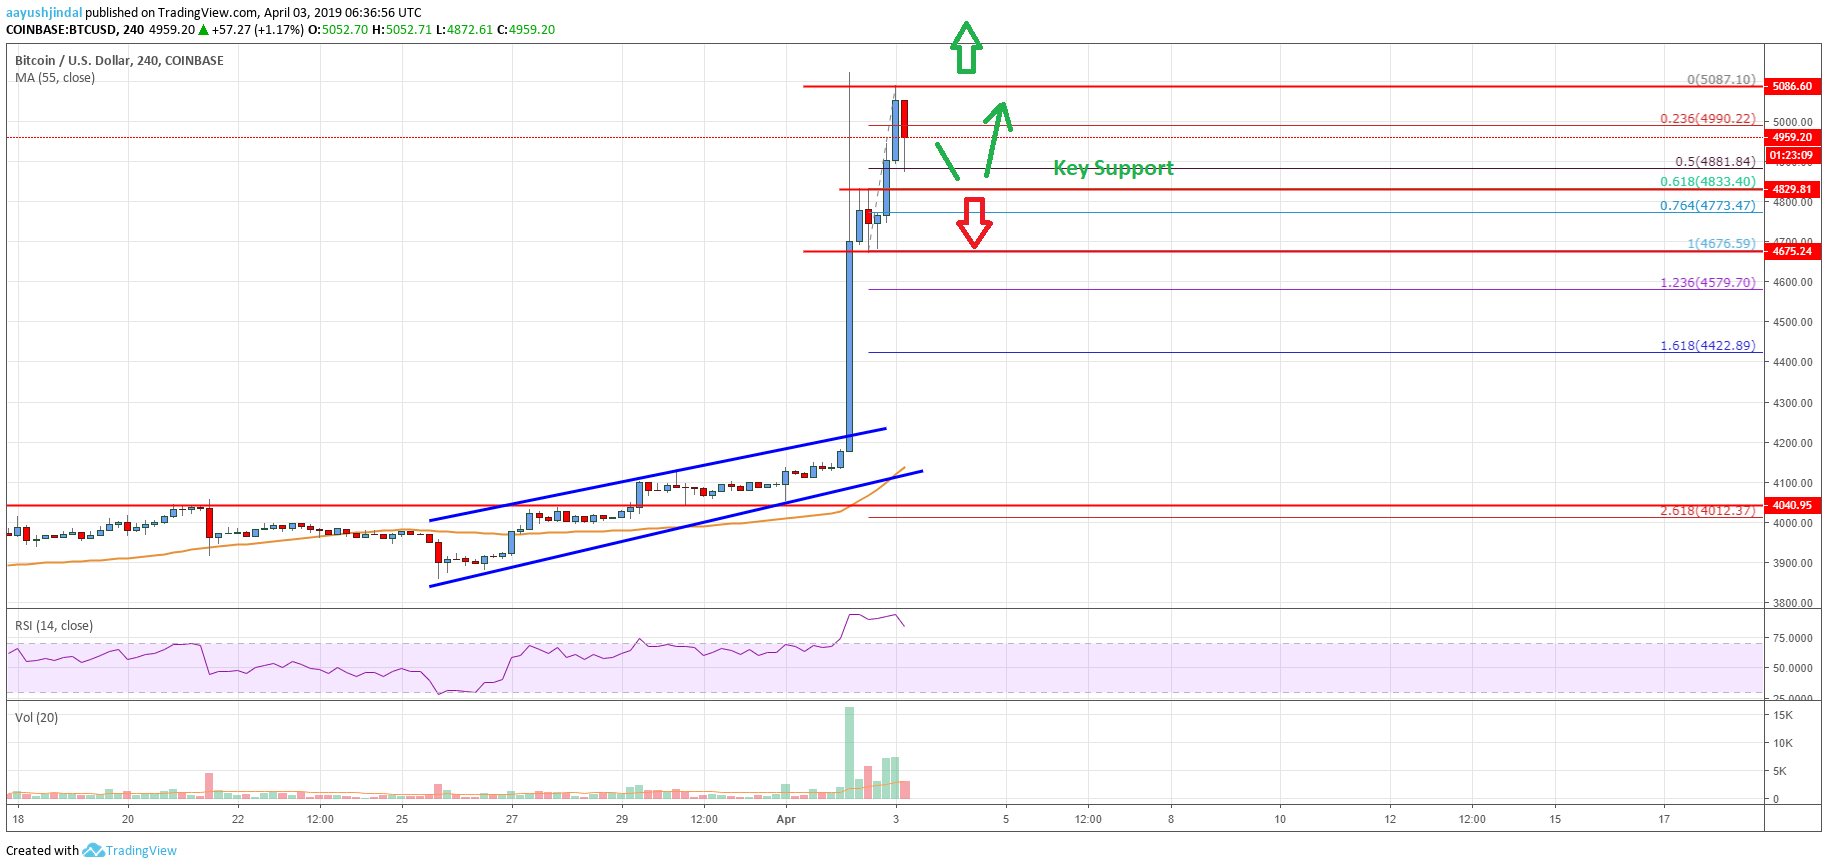
- There was a break above a crucial ascending channel with resistance at $4,220 on the 4-hours chart of the BTC/USD pair (data feed from Coinbase).
- The pair is currently consolidating near $5,000, with support at $4,885 and $4,835.
Bitcoin price jumped into a strong uptrend above the $4,700 level against the US Dollar. BTC even traded above $5,000 and it is likely to continue higher towards $5,250 and $5,400.
Bitcoin Price Analysis
This week started with a bang as bitcoin price gained a strong bullish momentum against the US Dollar. Earlier, the BTC/USD pair formed a support base near $3,900 and later moved above the $4,000 resistance level. There was a close above the $4,040 resistance and the 55 simple moving average (4-hours). The price started following a bullish path and slowly moved above the $4,100 and $4,160 levels. Finally, there was a break above the $4,200 resistance, which started the recent surge.
Moreover, there was a break above a crucial ascending channel with resistance at $4,220 on the 4-hours chart of the BTC/USD pair. The pair climbed higher sharply and broke the $4,550 and $4,780 resistance levels. There was even a break above the $5,000 level and the price traded as high as $5,087. It is currently retreating from highs and traded below $5,000. There was a break below the 23.6% Fib retracement level of the recent wave from the $4,676 low to $5,086 high.
However, the price found support near the $4,885 level. The 50% Fib retracement level of the recent wave from the $4,676 low to $5,086 high is also near the $4,885 level. If there is a break below the $4,885 support, the price could test the $4,835 support and pivot area. A break below $4,835 might push the price towards the $4,675 support.

Looking at the chart, bitcoin price is placed nicely in an uptrend above $4,835 and $4,675. If it stays above $4,835, there could be a fresh increase above the $5,020 and $5,080 resistance levels. The next key resistance is at $5,120, above which the price may climb towards the $5,250 level. On the other hand, a break below the $4,835 level might call for an extended correction towards the $4,675 support.
Technical indicators
4 hour MACD – The MACD is placed heavily in the bullish zone, with a positive bias.
4 hour RSI (Relative Strength Index) – The RSI recently started a downside correction from the 90 level.
Key Support Levels – $4,885 and $4,835.
Key Resistance Levels – $5,020, $5,080 and $5,250.


Leave a Reply
You must be logged in to post a comment.