- Bitcoin price corrected lower below the $3,950 support against the US Dollar.
- The price tested the $3,875 support level and recently bounced back sharply above $3,980.
- There is a significant bullish trend line in place with support at $3,900 on the 4-hours chart of the BTC/USD pair (data feed from Coinbase).
- The pair broke the key $3,950 resistance and moved into a fresh bull phase.
Bitcoin price reversed sharply from the $3,860 low against the US Dollar. BTC is back in an uptrend above $3,950 and it could continue higher towards the $4,040 resistance area.
Bitcoin Price Analysis
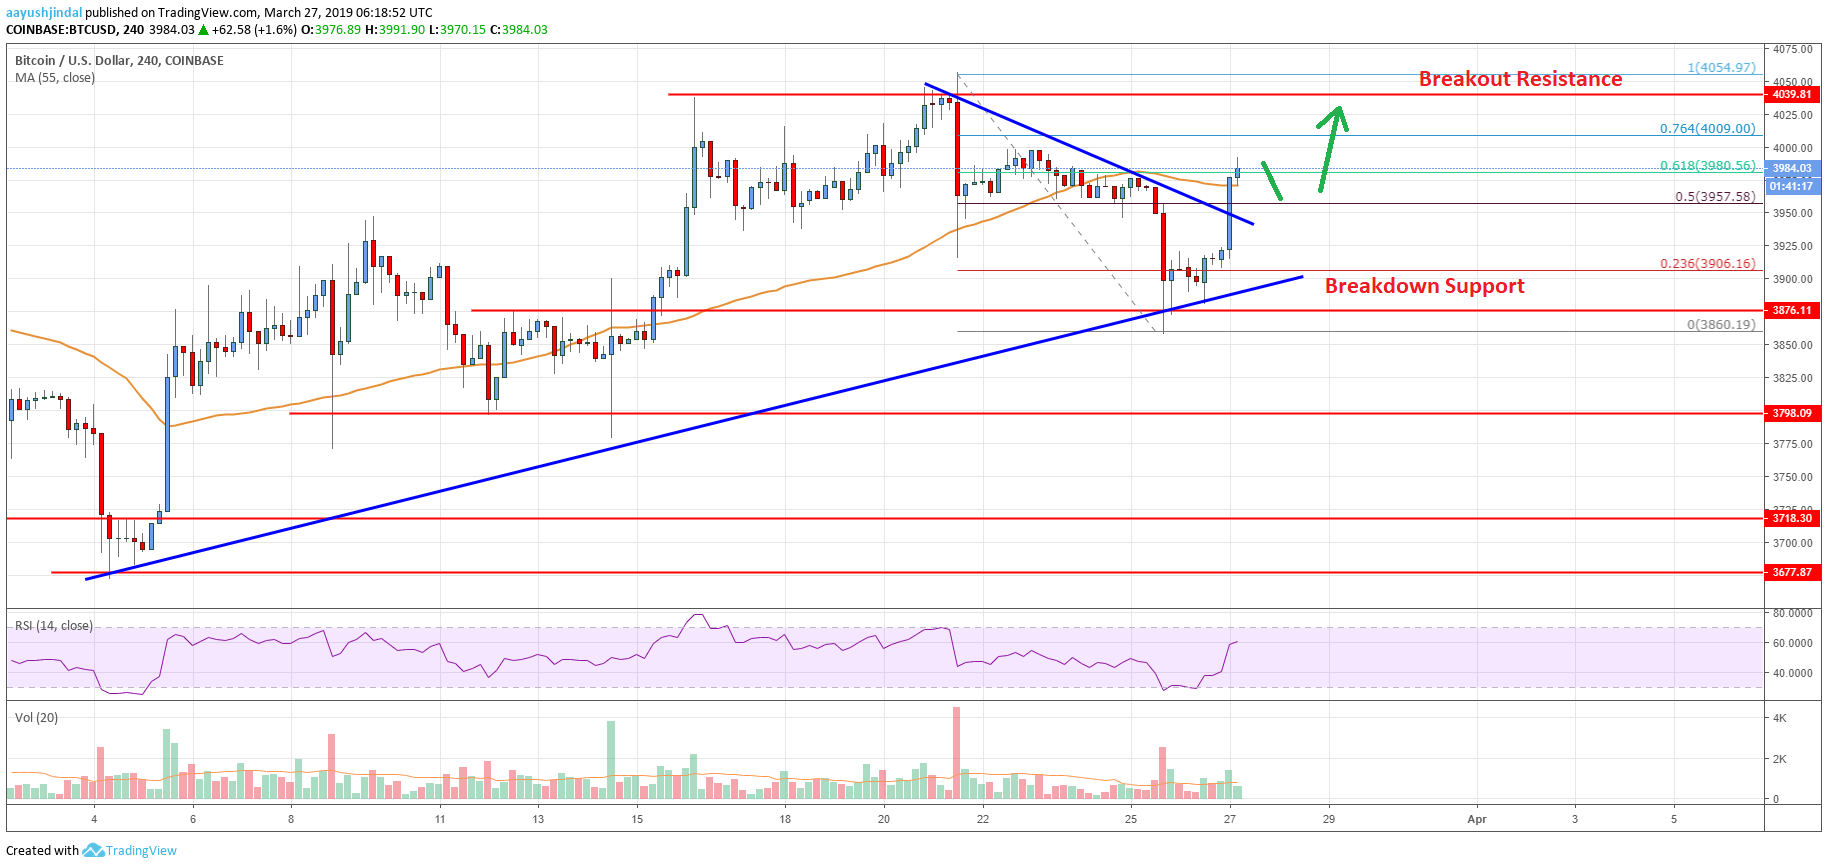
This past week, bitcoin price traded to a new monthly high at $4,054 and later corrected lower against the US Dollar. The BTC/USD pair started a substantial decline and broke the $3,950 and $3,900 support levels. There was even a close below the $3,950 level and the 55 simple moving average (4-hours). The price traded towards the $3,875 support and formed a low at $3,860. Buyers protected further losses and later a support base was formed near $3,875.
There is also a significant bullish trend line in place with support at $3,900 on the 4-hours chart of the BTC/USD pair. Finally, the price started a strong upward move and broke the $3,950 resistance. There was a break above the 50% Fib retracement level of the last slide from the $4,054 high to $3,860 low. Besides, the price surpassed a connecting bearish trend line with resistance at $3,948 on the same chart. Finally, the price climbed above $3,980 and the 55 simple moving average (4-hours).
The price is now trading near the 61.8% Fib retracement level of the last slide from the $4,054 high to $3,860 low. Once there is a break above the $4,000 and $4,010 resistance levels, the price could accelerate towards the $4,040 resistance. In the mentioned case, the price may even test the $4,054 swing high. The next key resistance levels are $4,100 and $4,180.

Looking at the chart, bitcoin price clearly jumped back in a positive zone after trading as low as $3,860. The current price action is bullish above $3,950 suggesting more upsides above $4,000 and $4,010. If there is a downside correction, the $3,950 level might act as a solid support. Below $3,950, the highlighted bullish trend line with support at $3,900 could act as a strong buy zone in the near term.
Technical indicators
4 hour MACD – The MACD is gaining momentum in the bullish zone, with a positive bias.
4 hour RSI (Relative Strength Index) – The RSI recently climbed sharply above the 50 level and tested the 60 level.
Key Support Levels – $3,950 and 3,900.
Key Resistance Levels – $4,000, $4,010 and $4,050.


Leave a Reply
You must be logged in to post a comment.