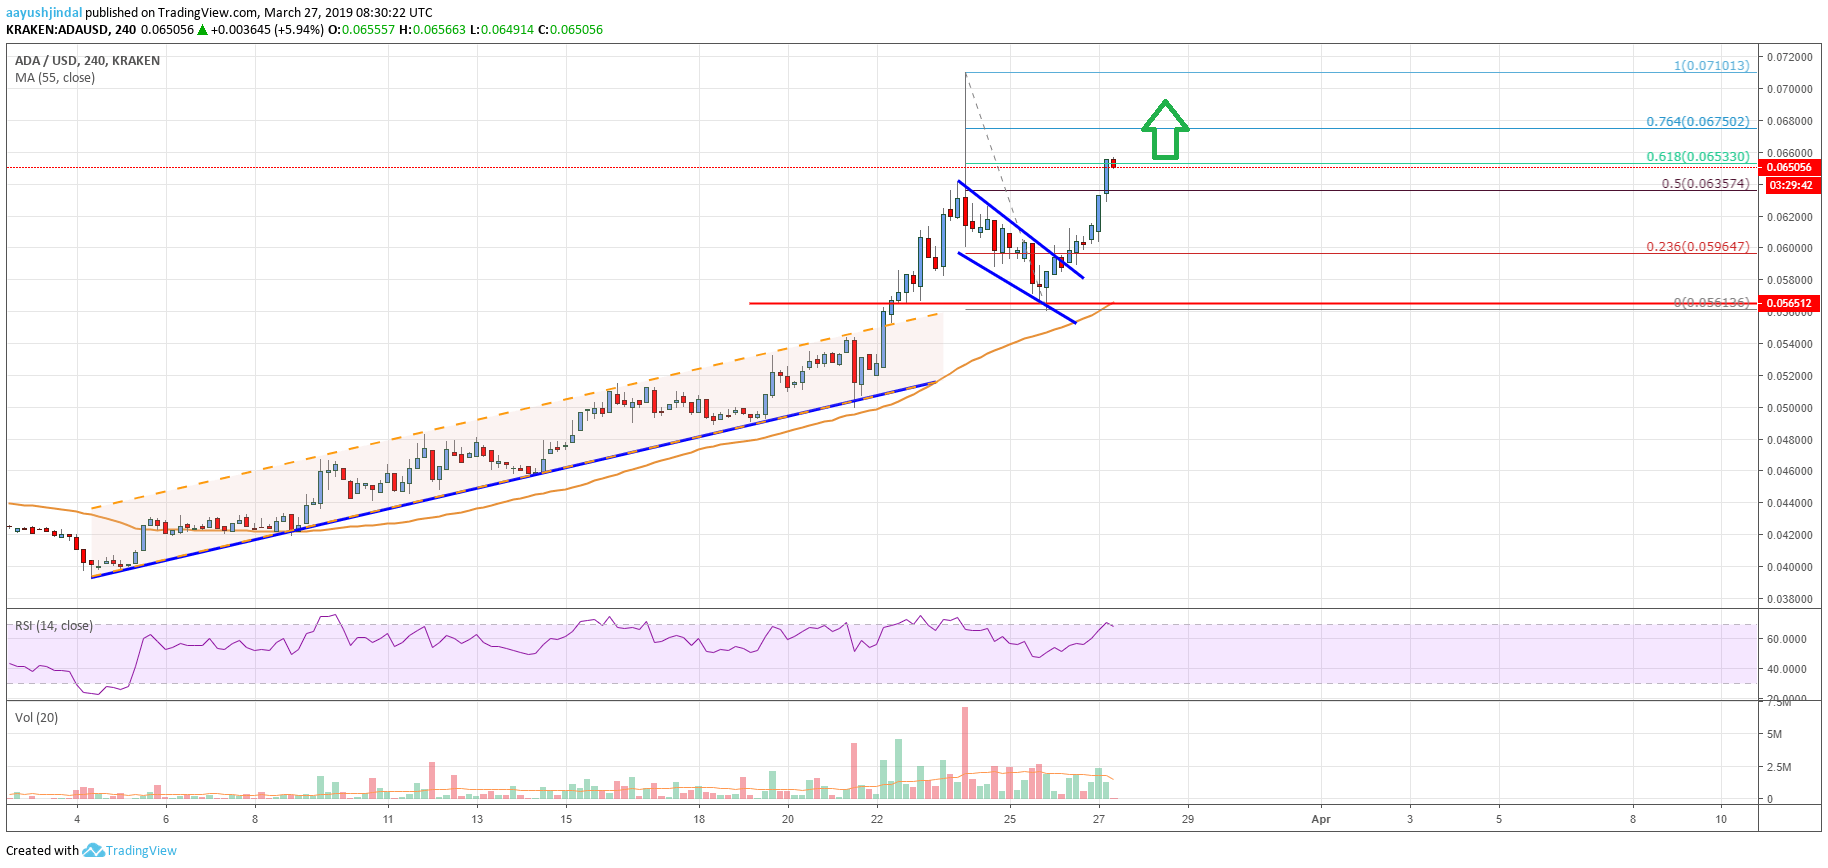
- ADA price tested the $0.0560 support level and climbed higher again against the US Dollar.
- The price rallied and broke the $0.0600 and $0.0625 resistance levels.
- There was a break above a major bullish flag pattern with resistance at $0.0600 on the 4-hours chart (data feed via Kraken).
- The price is surging higher and it might soon revisit the $0.0710 swing high in the near term.
Cardano price remains in a strong uptrend against the US Dollar and bitcoin. ADA recently corrected lower, tested the $0.0560 support, and it is currently rallying towards the $0.0700 resistance.
Cardano Price Analysis
There was a strong uptrend established from the $0.0420 low in cardano price against the US Dollar. The ADA/USD pair gained traction above the $0.0500 and $0.0550 resistance levels. There was even a solid close above $0.0550 and the 55 simple moving average (4-hours). In the last analysis, we saw a crucial ascending channel with support at $0.0500 on the 4-hours chart. The pair kept following the ascending channel and later spiked above the $0.0560 resistance.
It opened the doors for more gains and the price rallied above the $0.0600 and $0.0660 resistance levels. A new monthly high was formed at $0.0710 and later there was a sharp downside correction. The price dipped below the $0.0600 support level. However, the $0.0560 support and the 55 simple moving average (4-hours) acted as strong supports. A fresh support base was formed and the price climbed above $0.0580. Besides, there was a break above a major bullish flag pattern with resistance at $0.0600 on the same chart.
Bulls pushed the price above the 50% Fibonacci retracement level of the last decline from the $0.0710 high to $0.0561 low. The current price action is positive above the $0.0640 level. At the moment, the price is testing the 61.8% Fibonacci retracement level of the last decline from the $0.0710 high to $0.0561 low. Therefore, there are chances of more gains above the $0.0650 and $0.0660 levels. The next key resistance is near the $0.0700 level.

The chart indicates that ADA price is gaining bullish momentum above the $0.0650 level. Once there is a break above the 76.4% Fibonacci retracement level of the last decline from the $0.0710 high to $0.0561 low, there could be a run towards $0.0710. If buyers remain in action, the price could even trade to a new high above $0.0720. On the downside, the $0.0625 level is an initial support, followed by $0.0600.
Technical Indicators
4 hours MACD – The MACD for ADA/USD is gaining pace in the bullish zone.
4 hours RSI – The RSI for ADA/USD is currently well above the 55 level, with a positive angle.
Key Support Levels – $0.0625 and $0.0600.
Key Resistance Levels – $0.0675 and $0.0710.


Leave a Reply
You must be logged in to post a comment.