- Litecoin price stayed above the key $57.00 support and recovered recently against the US Dollar.
- LTC price is currently trading near a crucial resistance area at $61.50-62.00.
- There is a major bullish trend line formed with support at $58.40 on the 4-hours chart of the LTC/USD pair (data feed from Coinbase).
- The pair remains supported on dips and it is likely to climb above the $62.00 and $64.00 resistance levels.
Litecoin price trading in broad range above key supports against the US Dollar and bitcoin. LTC may correct a few points before it clears the $62.00 barrier for an upside acceleration.
Litecoin Price Analysis
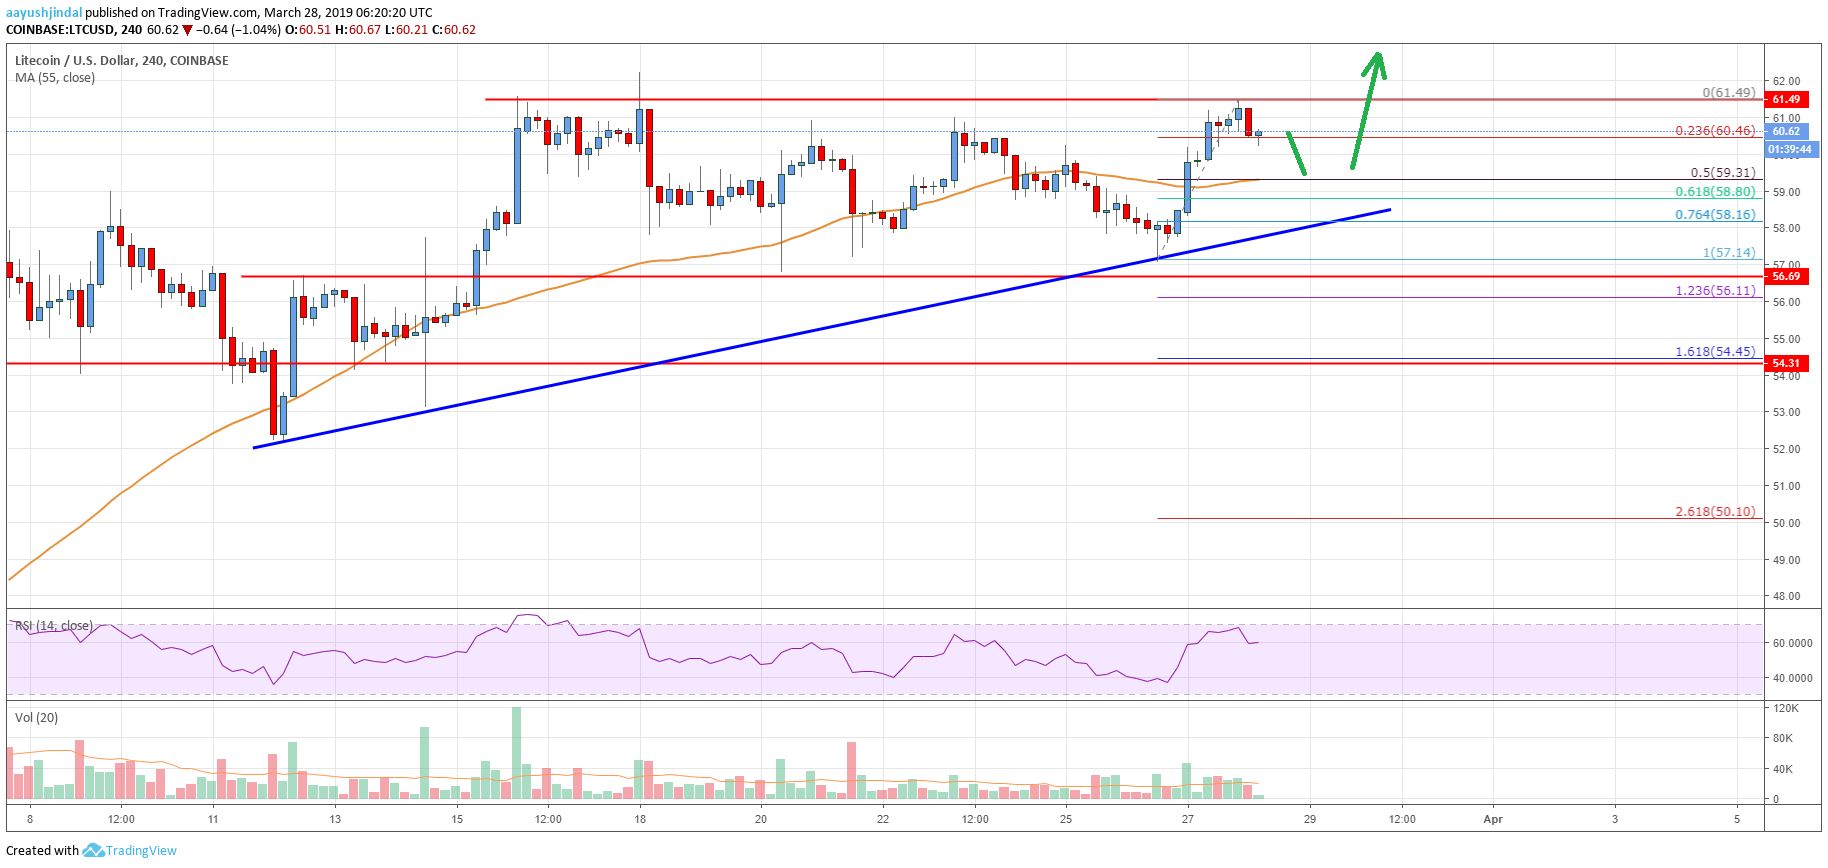
After testing the $62.00 resistance level, litecoin price corrected lower against the US Dollar. The LTC/USD pair declined below the $60.00 support level. However, there was a strong buying interest seen near the $58.00 area and the 55 simple moving average (4-hours). Additionally, the 50% Fib retracement level of the key upside from the $52.37 low to $62.25 high acted as a support. Later, there were range moves before the price reclaimed the $60.00 pivot level.
Recently, there were bullish moves in bitcoin, Ethereum, ripple, Litecoin, EOS, ADA, TRX and other cryptocurrencies. LTC price climbed higher and retested the $61.50-$62.00 resistance. Buyers failed to gain momentum above the $61.50 level and the price is currently correcting lower. It tested the 23.6% Fib retracement level of the last wave from the $57.14 low to $61.49 high. However, there are many supports on the downside near the $60.00 and $59.00 levels.
There is also a major bullish trend line formed with support at $58.40 on the 4-hours chart of the LTC/USD pair. Above the trend line, the 50% Fib retracement level of the last wave from the $57.14 low to $61.49 high is near $59.30. Therefore, if the price corrects lower further, it could find support near $59.30 or $58.40. Below the trend line, the price may retest the all-important range support near the $57.00 level.

Looking at the chart, litecoin price is clearly trading in a bullish zone above the $58.40 trend line support. On the upside, a clear break above the $61.50 and $62.00 resistance levels is must for buyers to gain traction. The next key resistance is near the $64.00 level, above which there are chances of a break above the $65.00 barrier. On the downside, the main supports are $58.40 and $57.00.
Technical indicators
4 hours MACD – The MACD for LTC/USD is placed nicely in the bullish zone, with a positive bias.
4 hours RSI (Relative Strength Index) – The RSI for LTC/USD is correcting lower from the 70 level.
Key Support Levels – $58.40 and $57.00.
Key Resistance Levels – $62.00 and $64.00.


Leave a Reply
You must be logged in to post a comment.