- EOS price rallied recently above the $3.75 and $3.98 resistance levels against the US Dollar.
- The price traded as high as $4.40 and it is currently consolidating gains.
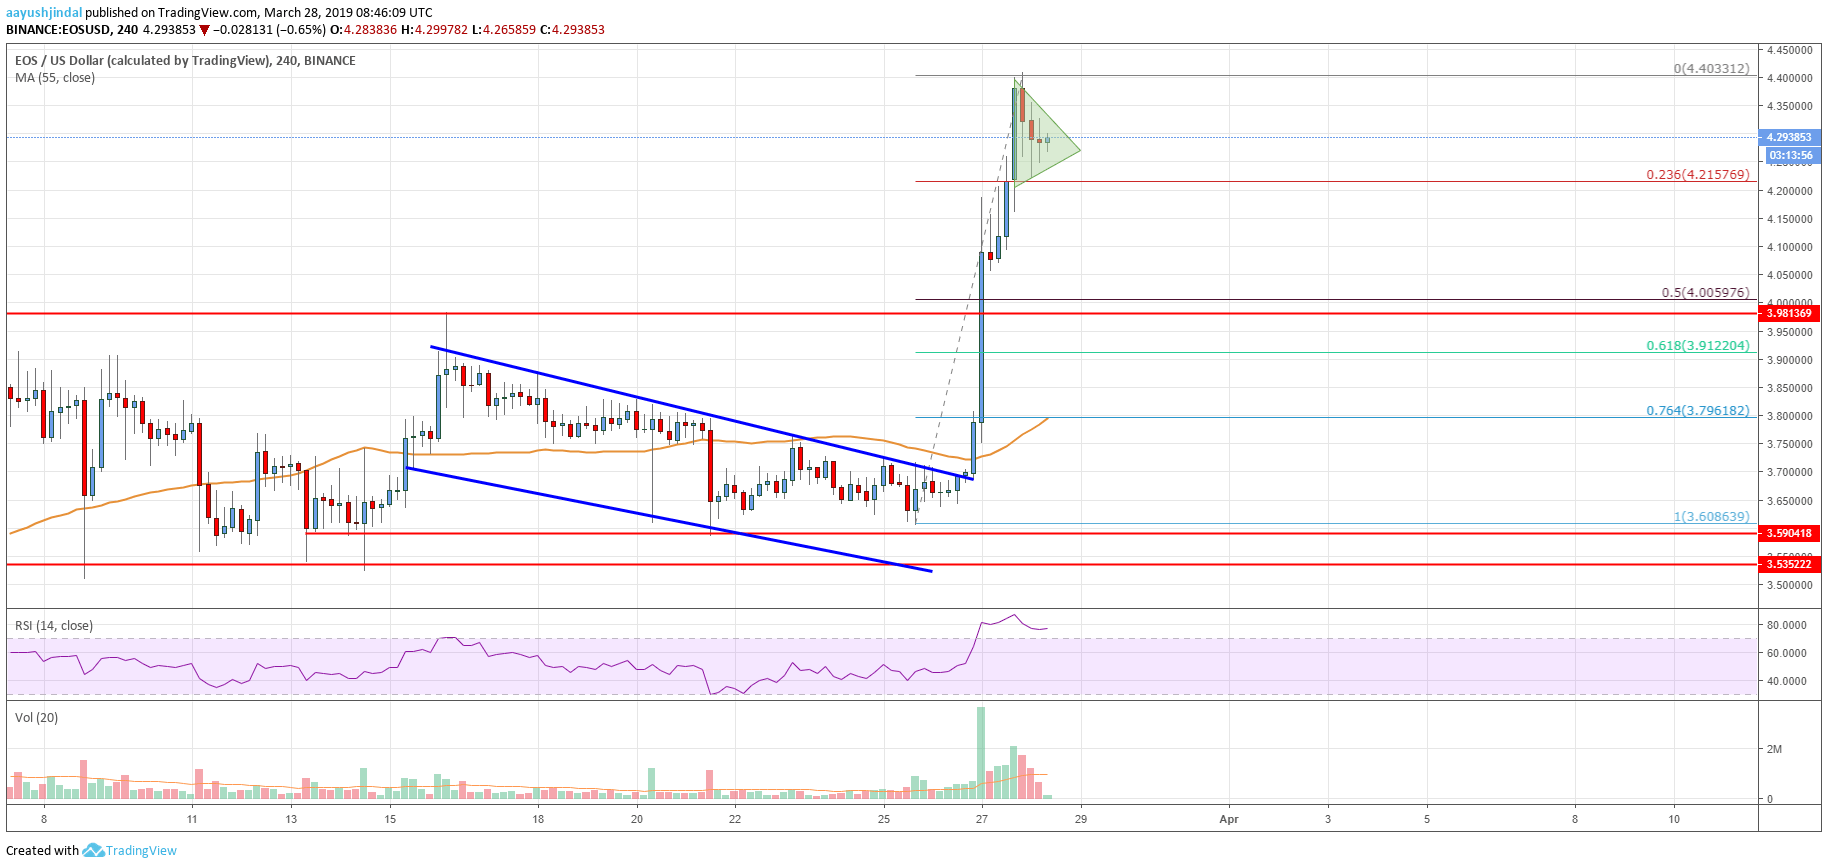
- There was a break above a crucial declining channel with resistance at $3.70 on the 4-hours chart of the EOS/USD pair (data feed from Binance).
- The pair is currently trading inside a short-term contracting triangle with resistance near $4.32.
EOS price surged above key resistance levels against the US Dollar. The price tested the $4.40 resistance and it is currently preparing for the next key break either above $4.35 or below $4.20.
EOS Price Analysis
Recently, there was a strong increase in bitcoin, Ethereum, ripple, litecoin and EOS price against the US Dollar. Earlier, EOS formed a solid support above the $3.54 and $3.58 levels. There were a few spikes, but sellers failed to push the price below the $3.50 level. Finally, there was a strong upward move above the $3.70 resistance level. There was even a close above the $3.75 pivot level and the 55 simple moving average (4-hours).
Moreover, there was a break above a crucial declining channel with resistance at $3.70 on the 4-hours chart of the EOS/USD pair. Finally, there was a strong close above the $3.98 resistance area, opening the doors for more gains. The upward move gained bullish momentum and the price surged above the $4.20 and $4.25 resistance levels. A new monthly high was formed at $4.40 and the price later started consolidating gains. There is a short-term contracting triangle in place with resistance near $4.32.
If there is a downside break, the price might test the 23.6% Fib retracement level of the recent wave from the $3.60 low to $4.40 high. However, if the price fails to stay above the $4.20 support, it could extend the downside correction. The next support is at $4.00 and the 50% Fib retracement level of the recent wave from the $3.60 low to $4.40 high. On the upside, an initial resistance is near the $4.35 level, above which the price could rally above $4.40 and $4.50.

Looking at the chart, EOS price clearly moved strongly into an uptrend above $4.00. In the short-term, there could be a downside correction, but the $4.20 level might act as a support. The main support is near the $4.00 level, below which the price is likely to move back in a bearish zone.
Technical indicators
Hourly MACD – The MACD for EOS/USD is currently reducing its bullish slope, with a positive bias.
Hourly RSI (Relative Strength Index) – The RSI surged towards the 80 level and it is currently correcting lower.
Major Support Levels – $4.25 and $4.20.
Major Resistance Levels – $4.35 and $4.40.


Leave a Reply
You must be logged in to post a comment.