- Ethereum price failed to stay above the $140 support area and declined recently against the US Dollar.
- ETH broke the key $134 support and the 55 simple moving average (4-hours) to move into a downtrend.
- There was a break below a crucial bullish trend line with support at $135 on the 4-hours chart (data feed from Coinbase).
- The price is now trading in a bearish zone and it may continue to slide towards $130 or $126.
Ethereum price turned bearish after it broke the $135 support against the US Dollar. ETH is likely to continue lower and it may test the $130 or $126 support level in the near term.
Ethereum Price Analysis
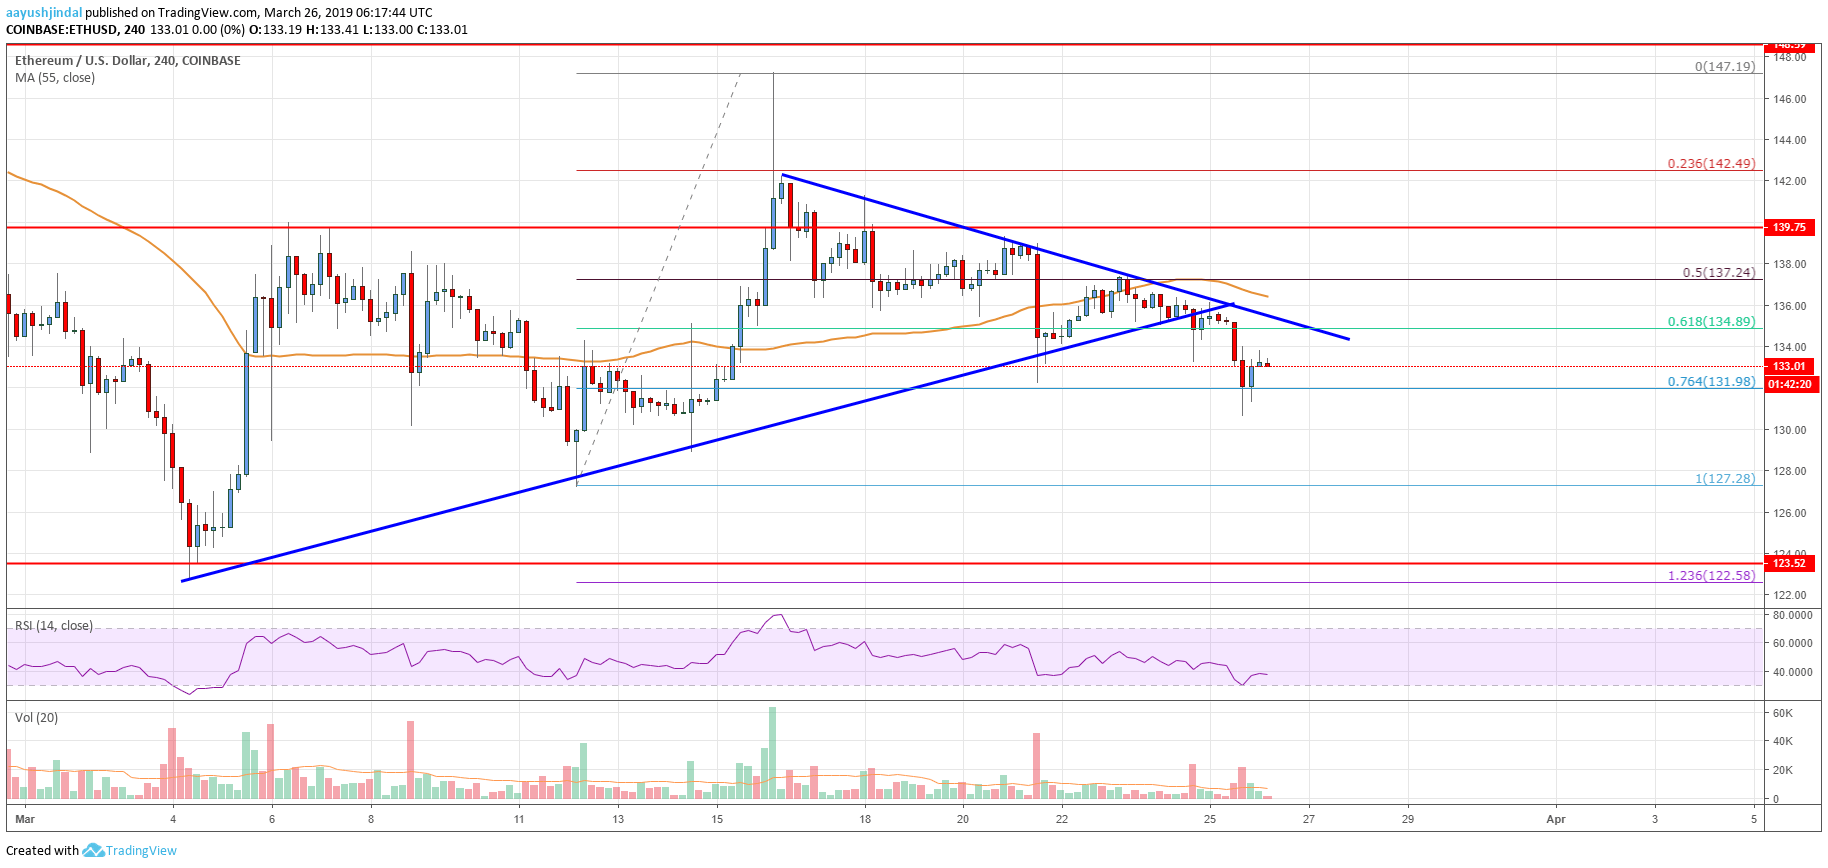
After a sharp upward move, Ethereum price topped near the $147 level against the US Dollar. The ETH/USD pair started a steady decline and moved below the $144 and $140 support levels. The pair even broke the $138 level and the 50% Fib retracement level of the last leg from the $127 low to $147 high. Later, there were range moves above the $135 support and the 55 simple moving average (4-hours).
Buyers continuously faced sellers near the $138 and $140 resistance levels. As a result, there was a bearish break below the $136 and $135 support levels. More importantly, there was a break below a crucial bullish trend line with support at $135 on the 4-hours chart. The pair settled below the $135 support and the 55 simple moving average (4-hours). Besides, there was a break below the 76.4% Fib retracement level of the last leg from the $127 low to $147 high.
The price traded close to the $130 support level and it recently corrected higher. An initial resistance on the upside is near the $135 level (the previous support). There is also a connecting bearish trend line in place with resistance at $134 on the same chart. Finally, the 55 simple moving average (4-hours) is positioned near the $136 level to act as a solid hurdle for buyers. Therefore, it won’t be easy for buyers to clear the $135 and $136 resistance levels.

Looking at the chart, Ethereum price is under a lot of pressure below $136 and the 55 simple moving average (4-hours). There could be range moves in the short term, but the price is likely to resume its decline below $130. The next key support is at $136, below which the price could test $120.
Technical indicators
4 hours MACD – The MACD for ETH/USD is gaining momentum in the bearish zone.
4 hours RSI (Relative Strength Index) – The RSI for ETH/USD is currently well below the 45 and 50 levels.
Key Support Levels – $130, followed by the $126 zone.
Key Resistance Levels – $135 and $136.


Leave a Reply
You must be logged in to post a comment.