- Ethereum price rallied towards the $148 level and later corrected lower against the US Dollar.
- ETH declined below the $140 and $138 support levels during the recent decline.
- There is a crucial bullish trend line in place with support at $133 on the 4-hours chart (data feed from Coinbase).
- The price is currently under pressure, but it is likely to bounce back as long as it is above $132.
Ethereum price is currently correcting recent gains against the US Dollar. ETH remains nicely supported on dips near the $133 and $132 support levels in the near term.
Ethereum Price Analysis
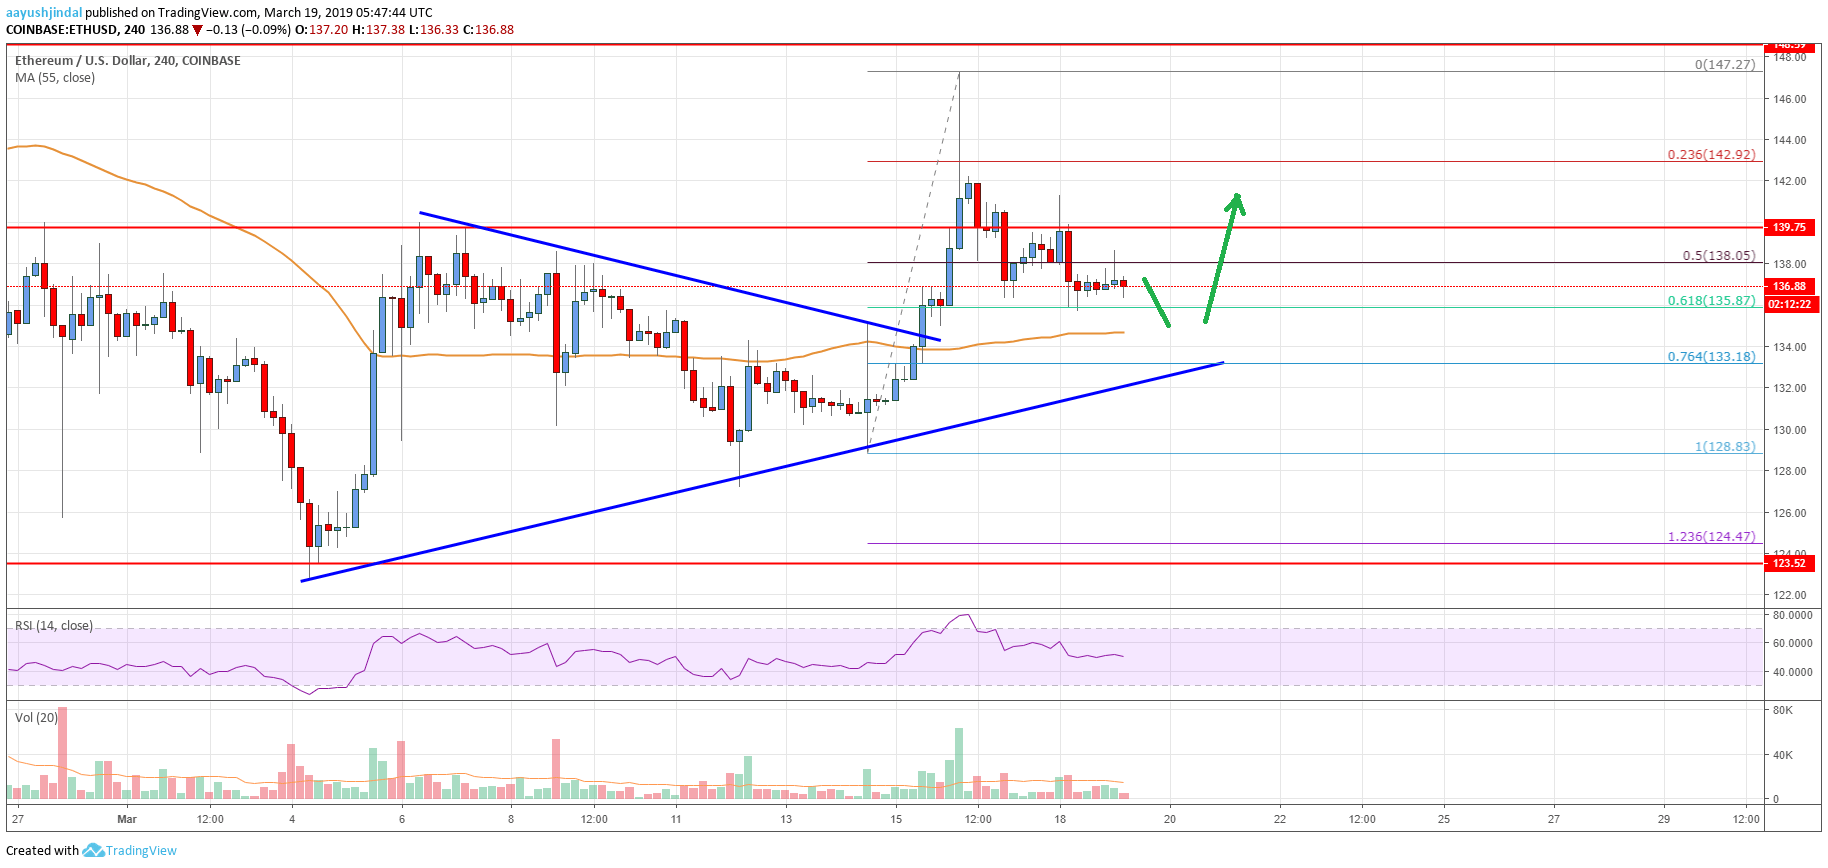
This past week, Ethereum price started a strong upward move from the $128 swing low against the US Dollar. The ETH/USD pair broke the $134 and $135 resistance levels to move into a positive zone. There was also a close above the $136 level and the 55 simple moving average (4-hours). The price gained traction above the $139-140 resistance area and climbed above the $145 level. A new monthly high was formed near $147 before the price started a downside correction.
It declined below the $142 and $140 support level. There was a break below the 50% Fib retracement level of the last wave from the $128 low to $147 high. However, there are many supports on the downside near the $136 and $133 levels. The price is currently consolidating above $136 and the 61.8% Fib retracement level of the last wave from the $128 low to $147 high. There is also a crucial bullish trend line in place with support at $133 on the 4-hours chart.
The trend line support near $133 is importance since it coincides with the 55 simple moving average (4-hours). If there is a downside break below $133 and $132, the price could move into a bearish zone. The next key support is near the $128 swing low. On the upside, the price must settle above the $139-140 resistance zone to gain bullish momentum. The next main resistances are $144 and $147.

Looking at the chart, Ethereum price clearly corrected most of its recent gains and traded below the $140 support. However, there are many key supports on the downside above $132. Therefore, there are high chances of a fresh upward move in ETH as long as it is trading above the $132 support. If buyers fail to hold $132, the price could slide towards $128 or $125.
Technical indicators
4 hours MACD – The MACD for ETH/USD is currently flat in the bearish zone, with a few positive signs.
4 hours RSI (Relative Strength Index) – The RSI for ETH/USD is currently flat near the 50 level.
Key Support Levels – $136, followed by the $133 zone.
Key Resistance Levels – $140 and $144.


Leave a Reply
You must be logged in to post a comment.