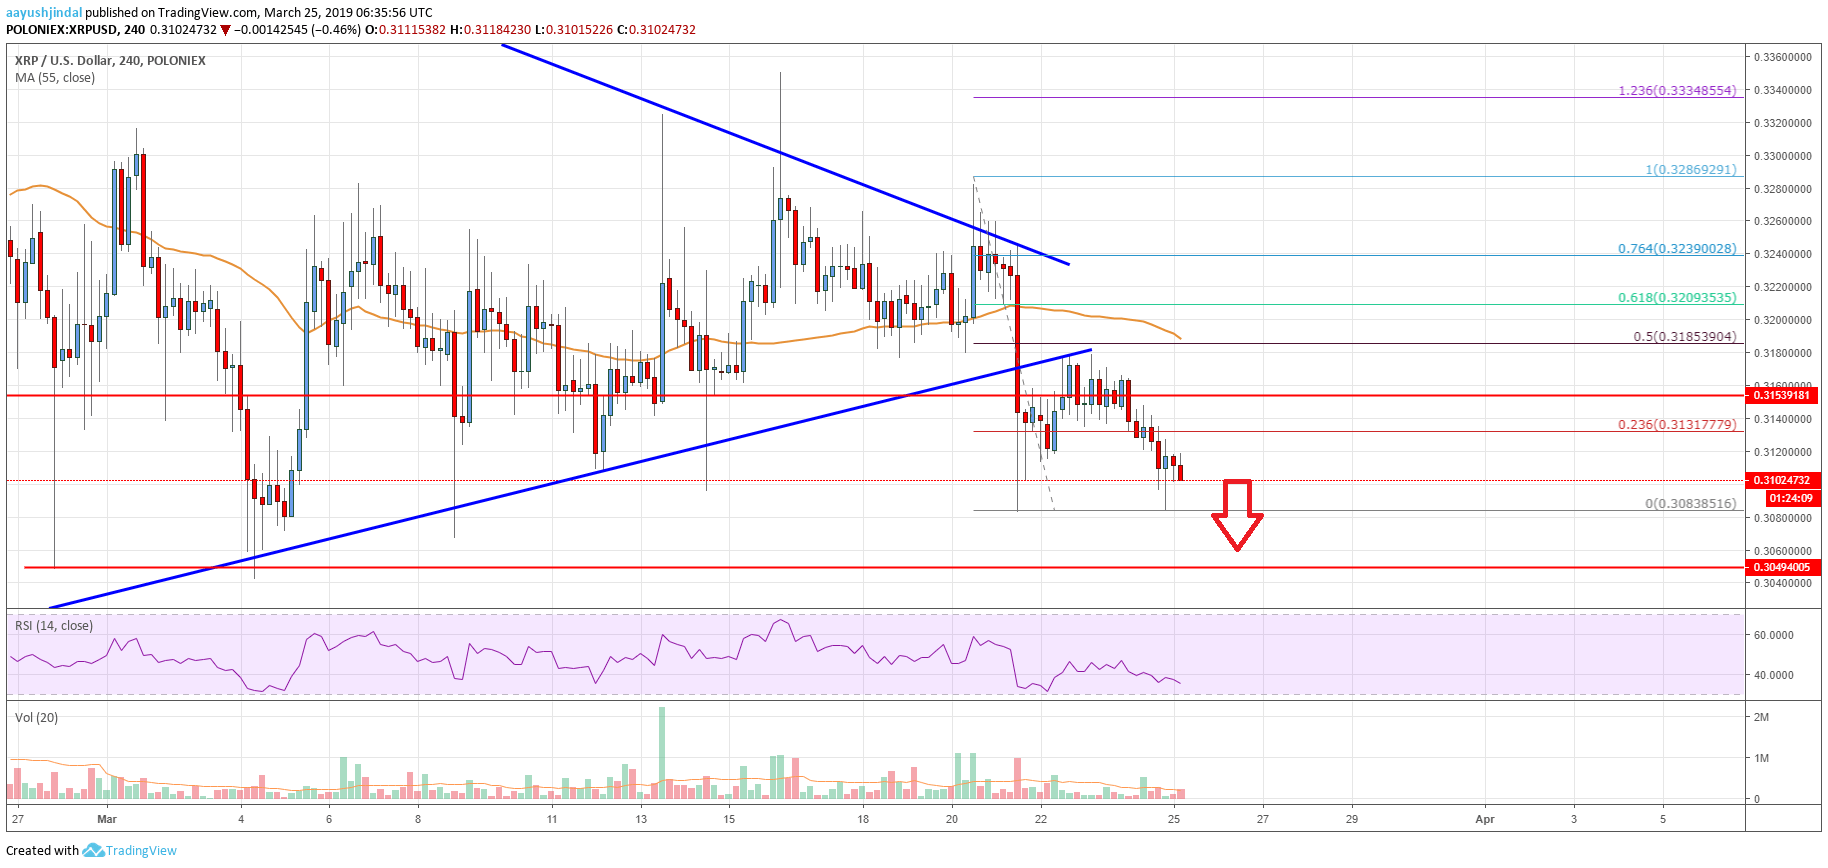
- Ripple price failed to break the $0.3240 and $0.3250 resistance levels against the US dollar.
- Buyers failed to hold a couple of important supports and the price declined below $0.3180.
- There was a break below a significant contracting triangle with support at $0.3180 on the 4-hours chart of the XRP/USD pair (data source from Poloniex).
- The price is now trading well below the $0.3155 support and it might decline strongly below $0.3085.
Ripple price is under a lot of selling pressure against the US Dollar. XRP broke the $0.3155 support and moved into a bearish zone, with a negative bias.
Ripple Price Analysis
This past week, there was a decent rebound in bitcoin, Ethereum, bitcoin cash, ADA and ripple against the US Dollar. The XRP/USD pair made a couple of attempts to clear the key $0.3250 and $0.3280 resistance levels. However, there was no convincing break above the $0.3300 resistance area. Buyers failed to gain pace above the $0.3240 and $0.3250 resistance levels. As a result, there was a downside reaction below the $0.3200 support and the 55 simple moving average (4-hours).
More importantly, there was a break below a significant contracting triangle with support at $0.3180 on the 4-hours chart of the XRP/USD pair. The pair settled below the triangle support and the $0.3155 pivot level. A swing low was formed at $0.3083 before the price corrected higher. It broke the 23.6% Fib retracement level of the last slide from the $0.3286 high to $0.3083 low. However, the broke triangle support acted as a resistance and prevented gains.
There was no test of the 50% Fib retracement level of the last slide from the $0.3286 high to $0.3083 low. The price declined again and it seems like sellers might push the price below the $0.3083 low. The recent bearish break could be significant and it is likely to spark heavy downsides below $0.3080 in the coming sessions. The next key support is at $0.3050, below which the price may revisit the $0.3000 support.

Looking at the chart, ripple price clearly broke a couple of important supports near $0.3180 and $0.3155. Therefore, there is a risk of more losses below the $0.3085 and $0.3050 levels. On the upside, the main resistance is at $0.3185 and the 55 simple moving average (4-hours). If buyers gain traction above the $0.3200 level, there could be a decent recovery above $0.3250.
Technical indicators
4 hours MACD – The MACD for XRP/USD is currently gaining bearish momentum, with a negative bias.
4 hours RSI (Relative Strength Index) – The RSI for XRP/USD declined recently and it is now well below the 40 level.
Key Support Levels – $0.3085, $0.3050 and $0.3000.
Key Resistance Levels – $0.3185 and $0.3200.


Leave a Reply
You must be logged in to post a comment.