- Stellar lumen price extended gains above the $0.1150 level before correcting lower against the US Dollar.
- XLM price traded as high as $0.1188 and later declined below $0.1100 and $0.1050.
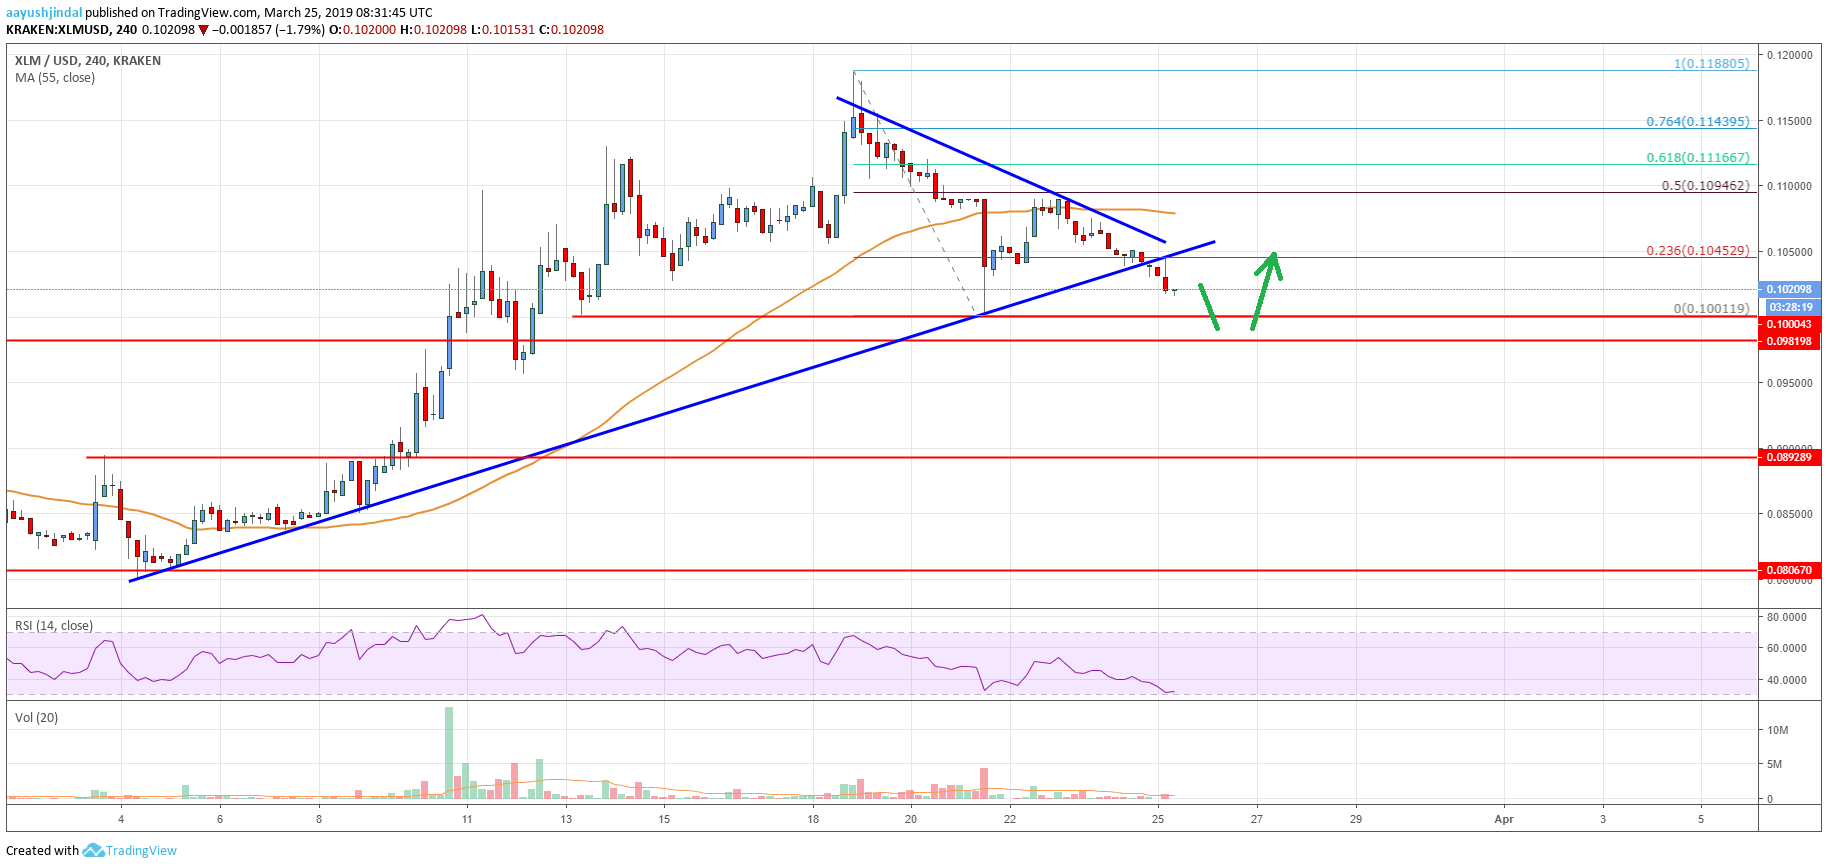
- There was a break below a crucial bullish trend line with support at $0.1045 on the 4-hours chart (data feed via Kraken).
- The pair likely moved into a bearish zone and it could extend losses towards $0.0980 or even $0.0950.
Stellar lumen price has started a major decline this week against the US Dollar, bitcoin and Ethereum. XLM price is under pressure and it may slide further towards $0.0950.
Stellar Lumen Price Analysis (XLM to USD)
In the last analysis, we discussed that a clear break above $0.1100 may increase chances of a fresh high in stellar lumen price against the US Dollar. The XLM/USD pair formed a decent support base above $0.1000 and extended gains above the $0.1100 and $0.1150 resistance levels. The price traded to a new monthly high at $0.1188 before sellers appeared. Later, there was a sharp decline and the price corrected below $0.1100. It tested the $0.1000 support level and recently corrected higher.
There was a break above the $0.1050 and $0.1060 levels. The price even traded above the 23.6% Fibonacci retracement level of the last decline from the $0.1188 high to $0.1001 low. However, the recovery was capped by the $0.1080 level and the 55 simple moving average (4-hours). Besides, the price failed just below the 50% Fibonacci retracement level of the last decline from the $0.1188 high to $0.1001 low. Finally, there was another drop below $0.1050.
There was a break below a crucial bullish trend line with support at $0.1045 on the 4-hours chart. Clearly, the price has moved into a bearish zone. Therefore, there is a risk of more losses towards the $0.1000 and $0.0980 support levels. In the mentioned case, the price may even trade below the $0.0980 support. The next key support is near the $0.0950, where buyers are likely to emerge.

The chart indicates that XLM price is slowly moving into a bearish zone below $0.1050. Having said that, the current wave can still be a correction from the $0.1188 swing high. The main support is at $0.0950, below which XLM might turn bearish and drop towards the $0.0800 swing support. On the upside, an initial resistance is at $0.1045. The key hurdle is at $0.1080 and the 55 simple moving average (4-hours).
Technical Indicators
4 hours MACD – The MACD for XLM/USD is currently gaining traction in the bearish zone.
4 hours RSI – The RSI for XLM/USD declined recently below 40 and it could test 20.
Key Support Levels – $0.1000 and $0.0950
Key Resistance Levels – $0.1045, $0.1080 and $0.1100.


Leave a Reply
You must be logged in to post a comment.