- ADA price started a strong upward move from the $0.0400 support area against the US Dollar.
- The price rallied and broke the $0.0480 and $0.0500 resistance levels.
- There is a crucial ascending channel formed with support at $0.0502 on the 4-hours chart (data feed via Kraken).
- The price remains in a strong uptrend and it is likely to extend gains above $0.0520 and $0.0550.
Cardano price extended gains and traded to new monthly highs against the US Dollar and bitcoin. ADA is trading above the $0.0500 support and it could continue higher towards $0.0550 or $0.0600.
Cardano Price Analysis
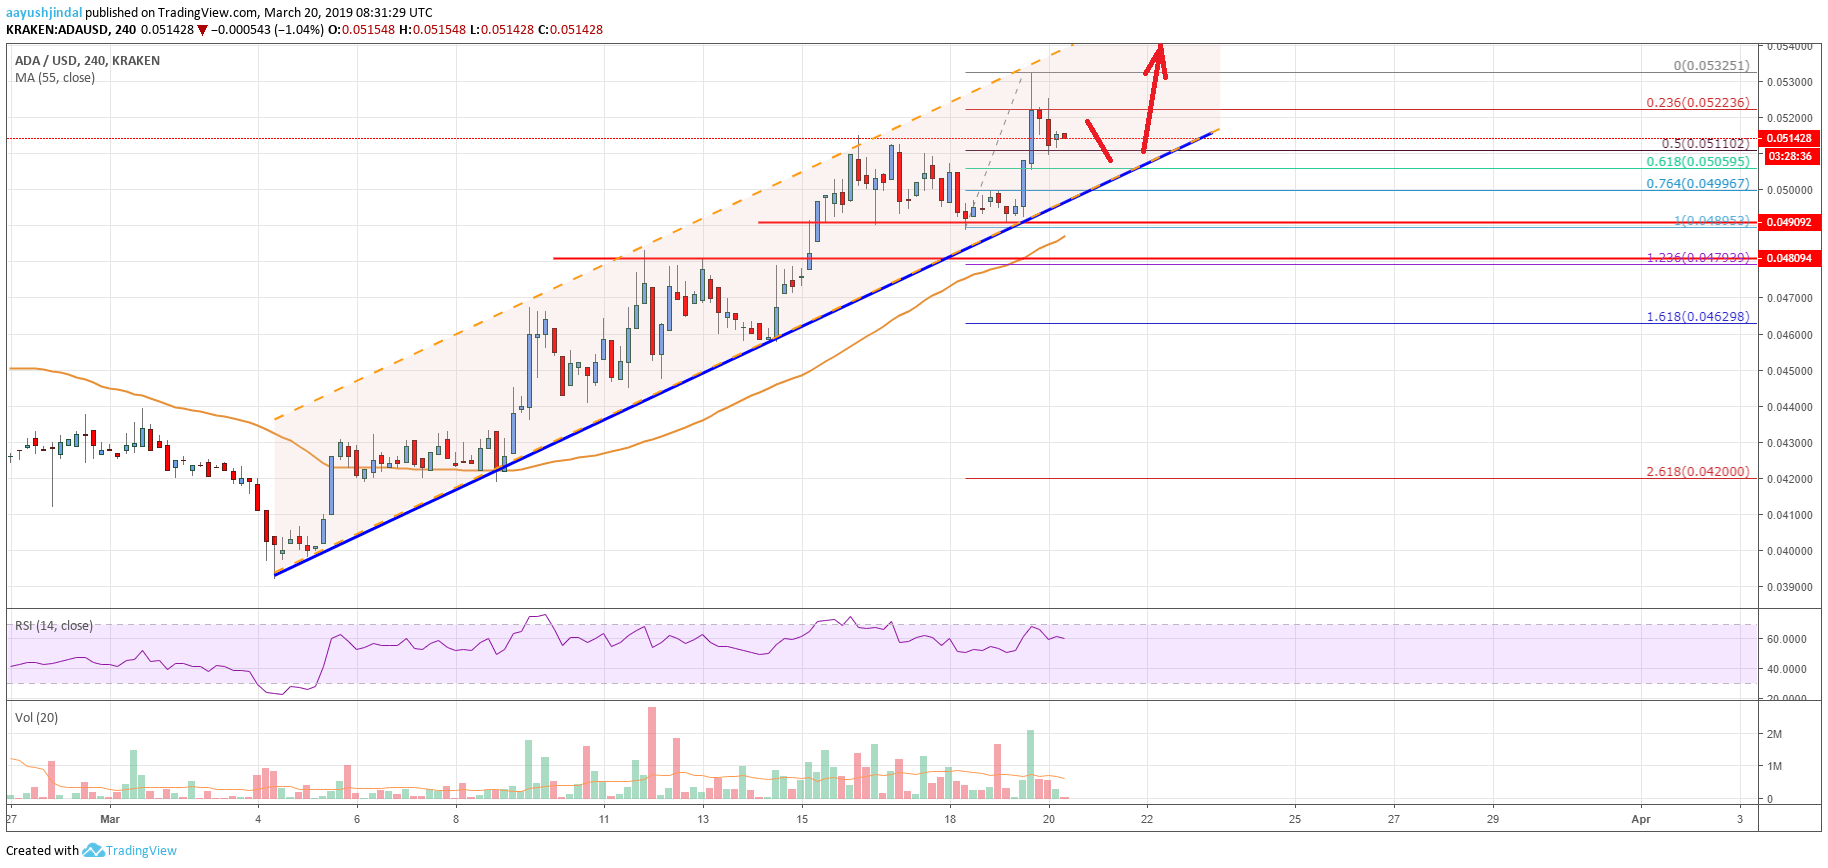
After forming a solid support near $0.0400, cardano price started a steady uptrend against the US Dollar. The ADA/USD pair broke many barriers on the way up, including $0.0420 and $0.0440. Later, there was a close above the $0.0450 resistance and the 55 simple moving average (4-hours). It opened the doors for more gains and the price rallied above the $0.0480 and $0.0500 resistance levels. The price traded to a new monthly high at $0.0532 and finally started a downside correction.
It recently traded below the $0.0520 support and the 23.6% Fibonacci retracement level of the last wave from the $0.0489 low to $0.0532 high. However, there are many supports on the downside near the $0.0510 level and $0.0500 levels. The price is currently holding the 50% Fibonacci retracement level of the last wave from the $0.0489 low to $0.0532 high. More importantly, there is a crucial ascending channel formed with support at $0.0502 on the 4-hours chart.
The channel support also coincides with the 61.8% Fibonacci retracement level of the last wave from the $0.0489 low to $0.0532 high. Therefore, as long as the price is above $0.0500, it is likely to bounce back. An initial resistance is at $0.0530, above which the price could climb towards the $0.0550 level. On the flip side, if there is a downside break below $0.0500, the price may start an extended downside correction. The next key supports are $0.0490 and $0.0480, where buyers may emerge.

The chart indicates that ADA price is placed nicely in a strong uptrend above the $0.0500 support level. In the near term, the price is likely to accelerate above $0.0530 and it could trade towards the $0.0550 level. If buyers remain in action, the price may perhaps test $0.0600. On the downside, there are many supports such as $0.0500, $0.0490 and $0.0480.
Technical Indicators
4 hours MACD – The MACD for ADA/USD is gaining momentum in the bullish zone.
4 hours RSI – The RSI for ADA/USD is currently well above the 50 level, with a positive bias.
Key Support Levels – $0.0500 and $0.0480.
Key Resistance Levels – $0.0530 and $0.0550.


Leave a Reply
You must be logged in to post a comment.