
Bitcoin price trades near $78K as analysts flag $80K as a key level. A close above could push BTC to $90K. A rejection may send it to $68K.
Bitcoin is trading near a critical price level, and analysts are watching closely.
At press time, BTC sits at $78,176. CoinGecko data shows a 0.33% gain in 24 hours.
The 7-day performance reflects a stronger 4.16% climb. The next few daily candles could determine where Bitcoin heads next.
Related reading:
$80K Bitcoin Price Level Is the Line in the Sand
Crypto analyst Ash Crypto laid out two clear scenarios.
According to the analyst, a daily close above $80,000 would confirm the current rally. That scenario points to a move toward the $86,000 to $90,000 range. However, a rejection at that level tells a different story.
Ash Crypto noted that failure to break above $80K could trigger a sharp drop. The $68,000 to $74,000 zone becomes the next area of interest in that case.
Two scenarios here
1) Bitcoin closes above $80k on daily and proves this rally and momentum is real and we see $BTC explode to $86k-$90k next
2) Bitcoin gets rejected from here and we see a sharp drop to $74k-$68k zone. pic.twitter.com/Zkm8psMaHl
— Ash Crypto (@AshCrypto) April 23, 2026
The $80K mark has attracted attention for more than just technical reasons. Trader Zord pointed out that most liquidations heading into $80K have already been cleared.
Short positions got squeezed significantly in the recent push.
He noted that the $80,000 to $91,000 range appears relatively thin in terms of liquidation clusters. That could mean price either reverses to hunt lower liquidity near $70,000, or it stalls before building enough short interest to fuel a push toward $93,000.
Zord has previously highlighted $93,000 as a key target level.
Liquidation Maps Shape the Short-Term Outlook
Liquidation data gives traders a way to anticipate where price might move next. When most shorts near a resistance level get wiped out, upward momentum can stall temporarily.
$BTC Most liquidations towards $80k have been cleared, shorts got liquidated alast. I don't see many liquidations from $80k to $91k which means either we turn down from somewhere here, and go towards hunting $70k below liquidations or we could stay here for a while, until more… https://t.co/UWwTPe7OX0 pic.twitter.com/w3kBeto0sz
— Zord (@ZordXBT) April 23, 2026
Zord suggested that markets may need time to rebuild short positions before another leg higher becomes possible.
Without that fuel, a sustained push above current levels remains uncertain. The $70,000 zone still holds relevance as an area with untapped downside liquidity.
Analyst Point to Bitcoin’s Long-Term Floor Model
Beyond the short-term charts, analyst David highlighted a different framework for viewing BTC’s price.
He described BTC as a “rising-floor option,” citing a structural floor currently sitting near $60,000. At $78,000, the gap between spot price and that floor stands at roughly $18,000.
David’s model, built on a power-law exponent of 5.7, projects that floor to rise significantly over time. By year one, the model places the floor near $82,700. By year five, it climbs toward $255,100.
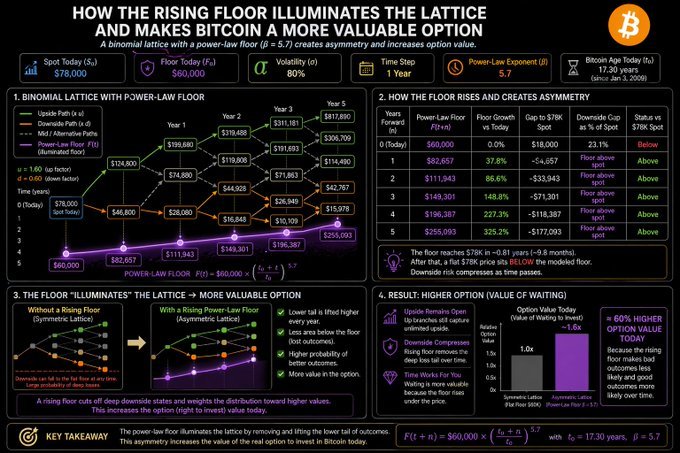
David argued that this rising floor changes how traders should evaluate downside risk. As time passes, the lower tail of potential outcomes shrinks.
The upside remains open while the floor moves upward. That dynamic, according to David, creates a form of asymmetry that benefits long-term holders.
The cushion between current price and the structural floor could disappear within approximately 10 months if price holds steady.


Leave a Reply
You must be logged in to post a comment.