
- Bitcoin price is declining and it is now trading well below $7,500 against the US Dollar.
- The price is likely to extend its decline towards the $7,040 support area.
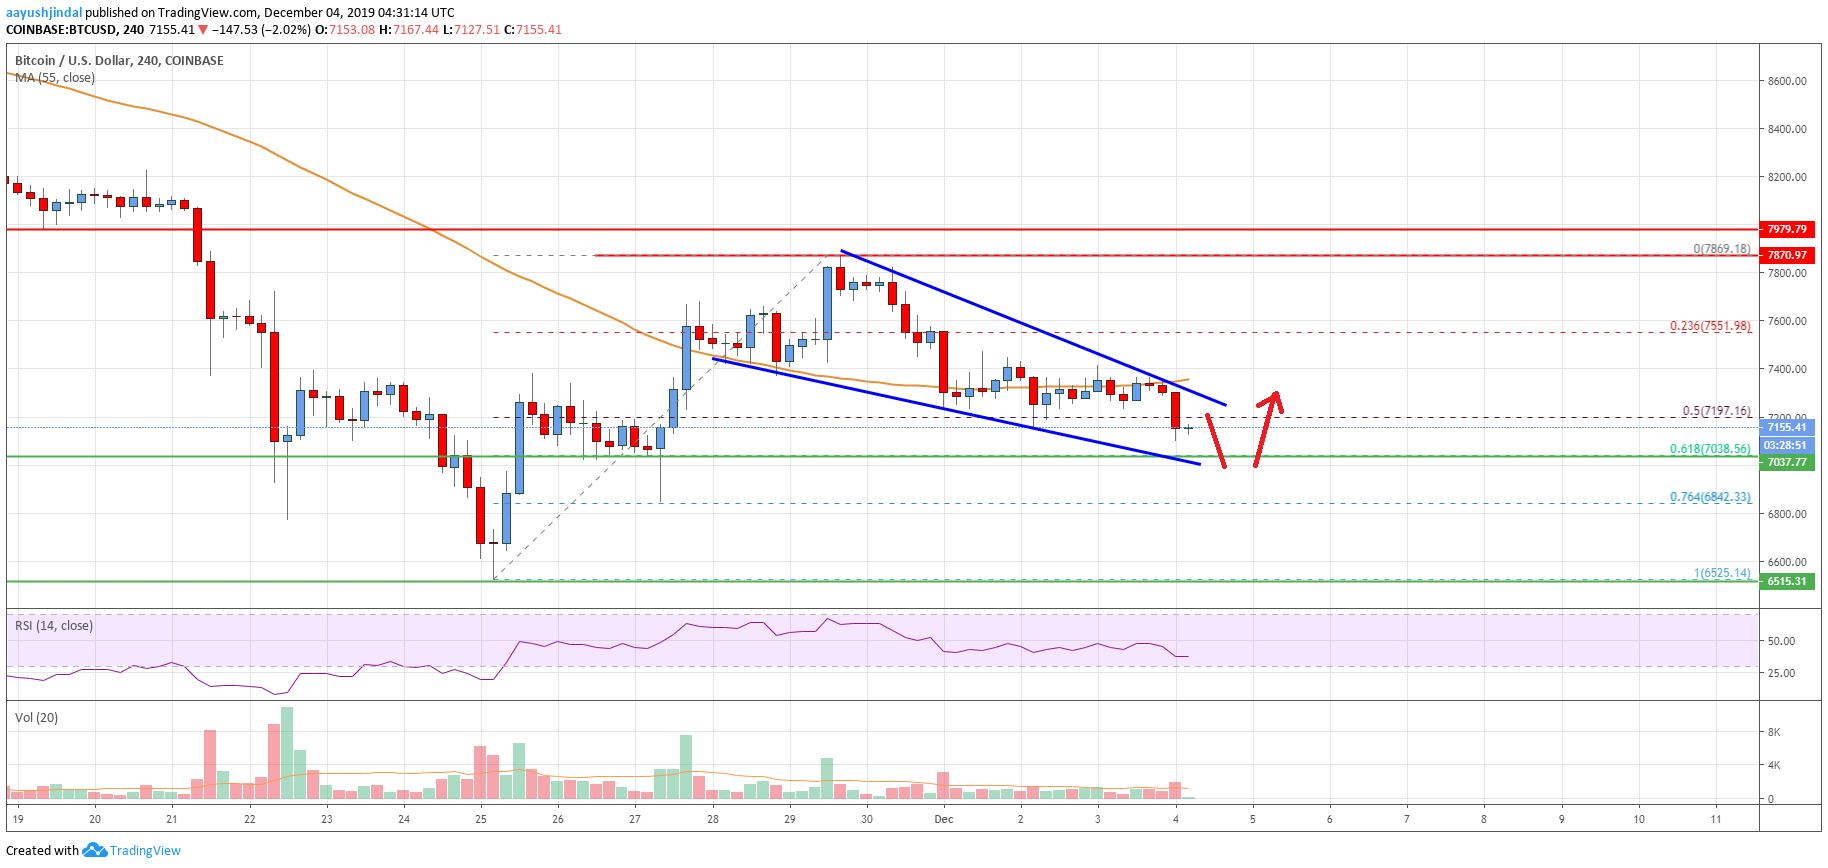
- There is a contracting triangle forming with resistance near $7,280 on the 4-hours chart of the BTC/USD pair (data feed from Coinbase).
- The pair could bounce back unless there is no daily close below $7,040 and $7,000.
Bitcoin price is showing bearish signs below $7,300 against the US Dollar. BTC is under pressure, but it might hold the $7,040 support area in the near term.
Bitcoin Price Analysis
This past week, bitcoin price tested the $7,870 and $7,900 resistance levels against the US Dollar. However, BTC failed to continue above $7,870 and started a fresh decline below the $7,600 support area.
Moreover, there was a close below the $7,500 level and the 55 simple moving average (4-hours). The recent decline gained pace below the 23.6% Fib retracement level of the last wave from the $6,525 low to $7,869 high.
Finally, the price traded below the $7,300 level and it is struggling to stay above $7,150. Besides, the 50% Fib retracement level of the last wave from the $6,525 low to $7,869 high is near the $7,197 level.
An immediate support is near the $7,040 level (the previous pivot area). It is also close to the 61.8% Fib retracement level of the last wave from the $6,525 low to $7,869 high.
Therefore, a downside break below the $7,040 and $7,000 support levels could open the doors for more downsides in the near term. In the mentioned case, there is a risk of a sharp decline in bitcoin price towards the $6,800 and $6,600 levels.
On the upside, an immediate resistance area is near the $7,280 and $7,300 levels. Additionally, there is a contracting triangle forming with resistance near $7,280 on the 4-hours chart of the BTC/USD pair.
If there is an upside break above the $7,300 level, the bulls might be able to gain strength. In this case, the price could start a fresh increase towards the $7,500 and $7,600 resistance levels.
Looking at the chart, bitcoin price is clearly approaching a crucial support area near the $7,040 and $7,000 levels. If not fails to stay above $7,000, there could be a downside extension. Otherwise, the price is likely to bounce back above $7,300 and $7,400.
Technical indicators
4 hour MACD – The MACD is slowly gaining momentum in the bearish zone.
4 hour RSI (Relative Strength Index) – The RSI is currently well below the 50 level, with no recovery signs.
Key Support Levels – $7,040 and $6,800.
Key Resistance Levels – $7,280, $7,300 and $7,500.


Leave a Reply
You must be logged in to post a comment.