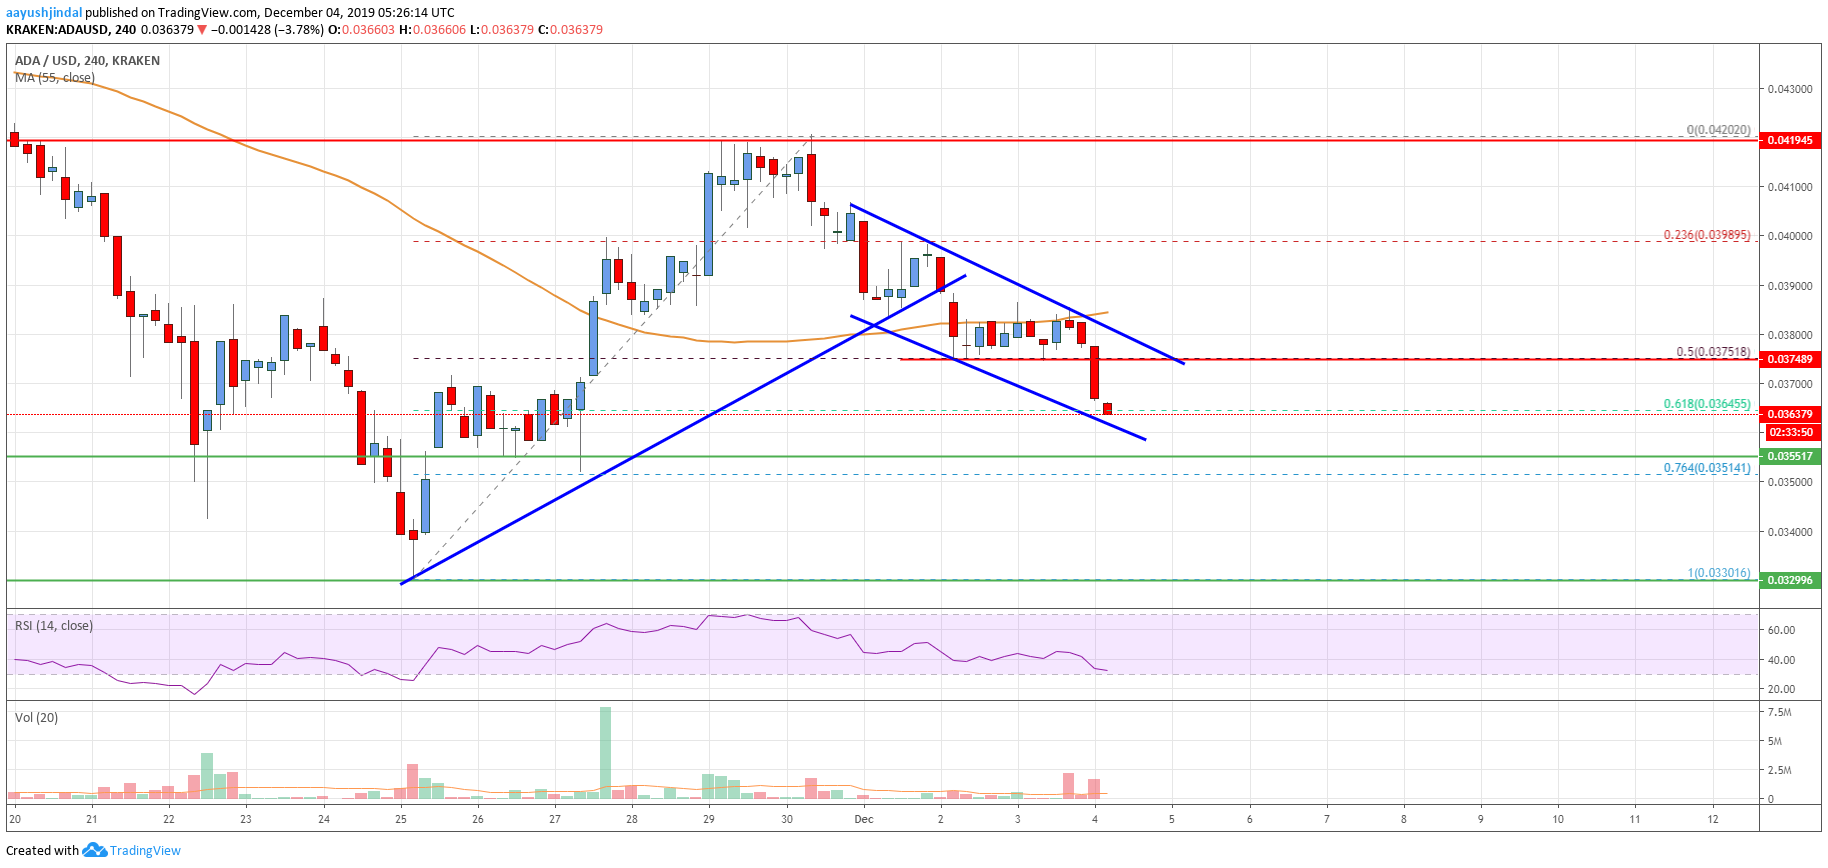
- ADA price started a fresh decline after it failed to surpass the $0.0420 resistance against the US Dollar.
- The price is currently declining and trading below the $0.0400 support area.
- There is a descending channel forming with resistance near $0.0375 on the 4-hours chart (data feed via Kraken).
- The price is likely to accelerate losses below the $0.0355 and $0.0350 support levels in the near term.
Cardano price is following a downtrend against the US Dollar and bitcoin. ADA price could continue to move down and it might even retest the $0.0330 swing low.
Cardano Price Analysis
This past week, cardano price made a couple of attempts to surpass the $0.0420 resistance area against the US Dollar. However, the ADA/USD pair failed to continue above $0.0420 and started a fresh decrease.
The pair broke the $0.0400 support area to enter a bearish zone. Moreover, there was a close below the $0.0400 level and the 55 simple moving average (4-hours).
It opened the doors for more downsides below the 50% Fibonacci retracement level of the upward move from the $0.0330 low to $0.0420 high. Besides, the price is now trading below the $0.0380 support, with a bearish angle.
An immediate support is near the $0.0355 level. Additionally, the 76.4% Fibonacci retracement level of the upward move from the $0.0330 low to $0.0420 high is near the $0.0350 level to provide support.
At the moment, it seems like there is a descending channel forming with resistance near $0.0375 on the 4-hours chart. Therefore, cardano price might continue to move down below the $0.0355 support.
If the bulls fails to protect the $0.0350 support, there is a risk of a sharp decline towards the $0.0330 swing low. Any further losses could lead the price towards the $0.0300 support area.
On the upside, the price must break the declining channel and the $0.0380 resistance level. The main resistance is near the $0.0400 level and the 55 simple moving average (4-hours).
If the price manages to climb above the channel resistance and $0.0400, it could revisit the $0.0420 resistance area. The next major resistance is near the $0.0450 level.

The chart indicates that ADA price is declining below a few important supports near $0.0400 and $0.0380. The bears seem to be in control, which may perhaps lead to a sharp decline towards the $0.0320 and $0.0300 support levels.
Technical Indicators
4 hours MACD – The MACD for ADA/USD is currently gaining momentum in the bearish zone.
4 hours RSI – The RSI for ADA/USD is currently declining and it now well below the 40 level.
Key Support Levels – $0.0350 and $0.0320.
Key Resistance Levels – $0.0380 and $0.0400.


Leave a Reply
You must be logged in to post a comment.