- Bitcoin price failed to surpass the $10,800 resistance and declined against the US Dollar.
- The price is now trading well below the $10,800 resistance and the 55 SMA (H4).
- There is a major breakout pattern forming with support near $10,540 on the 4-hours chart of the BTC/USD pair (data feed from Coinbase).
- The pair is likely to decline sharply if there is a break below the $10,540 and $10,500 support levels.
Bitcoin price is currently showing a few bearish signs below $10,700 against the US Dollar. BTC remains at a risk of a larger decline if it breaks the $10,540 support.
Bitcoin Price Analysis
In the past few days, bitcoin price started a decent recovery wave above $10,600 against the US Dollar. BTC was able to climb above the $10,700 level and the 55 simple moving average (4-hours).
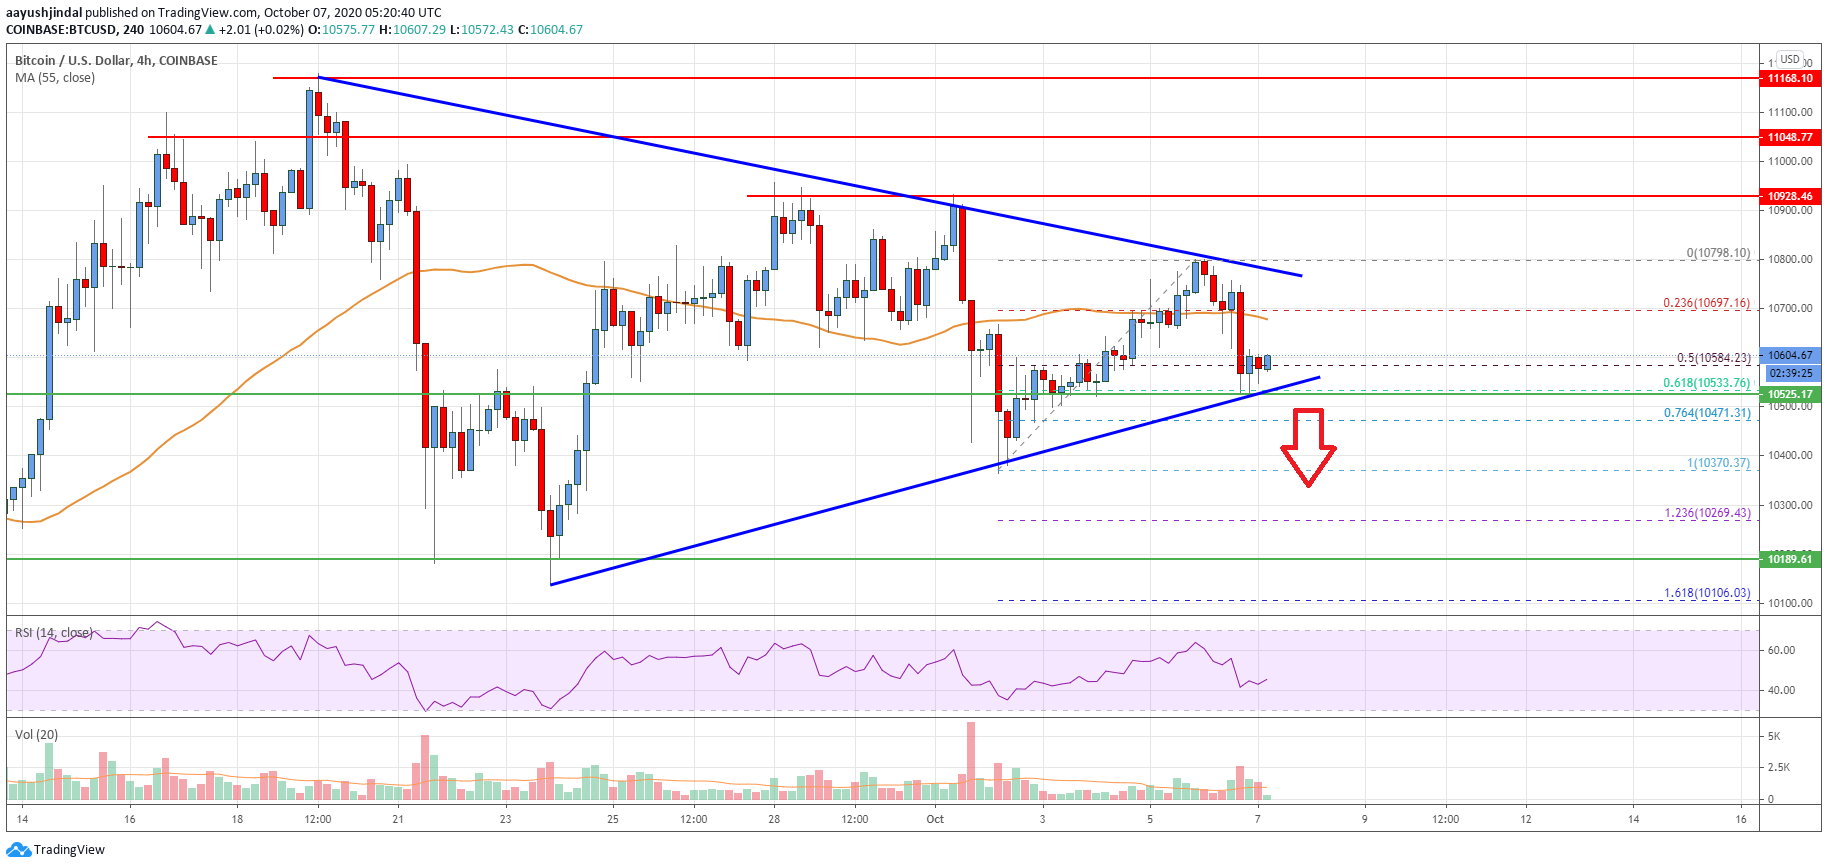
However, the price struggled to clear the $10,800 resistance level. There was a sharp bearish reaction from the $10,798 high and the price declined below the $10,700 level. The price even broke the 50% Fib retracement level of the upward move from the $10,370 swing low to $10,798 high.
The price is now trading well below the $10,800 resistance and the 55 SMA (H4). On the downside, there is a strong support forming near the $10,540 level. There is also a major breakout pattern forming with support near $10,540 on the 4-hours chart of the BTC/USD pair.
The 61.8% Fib retracement level of the upward move from the $10,370 swing low to $10,798 high is also near the $10,540 support zone. If there is a downside break below the triangle support and $10,540, there is a risk of a larger decline.
In the stated case, the price could revisit the $10,370 swing low. The next major support could be $10,270 level since it is close to the 1.236 Fib extension level of the upward move from the $10,370 swing low to $10,798 high.
Conversely, bitcoin price might start a fresh increase above the $10,650 and $10,700 levels. To move into a positive zone, the price must gain momentum above the triangle resistance and the $10,800 level.

Looking at the chart, bitcoin price is clearly struggling to stay above $10,540 and it is well below the 55 SMA (H4). Therefore, the price is likely to decline sharply if there is a break below the $10,540 and $10,500 support levels.
Technical indicators
4 hours MACD – The MACD is struggling to gain pace in the bearish zone.
4 hours RSI (Relative Strength Index) – The RSI is now well below the 50 level.
Key Support Levels – $10,540 and $10,500.
Key Resistance Levels – $10,700, $10,800 and $11,000.


Leave a Reply
You must be logged in to post a comment.