- Bitcoin price started a fresh decline from the $11,175 swing high against the US Dollar.
- The price is now trading well below the $10,580 support level and the 55 SMA (H4).
- There was a break below a crucial bullish trend line with support near $10,800 on the 4-hours chart of the BTC/USD pair (data feed from Coinbase).
- The pair is likely to extend losses as long as it is below the $10,580 and $10,750 resistance levels.
Bitcoin price is currently trading in a bearish zone below $10,580 against the US Dollar. BTC remains at a risk of more losses below the $10,200 and $10,000 levels.
Bitcoin Price Analysis
In the past few sessions, bitcoin price saw a sharp decline from well above the $11,000 level against the US Dollar. BTC broke a couple of key supports near the $10,750 level to move into a bearish zone.
The decline was such that the price declined below the $10,580 support and the 55 simple moving average (4-hours). More importantly, there was a break below a crucial bullish trend line with support near $10,800 on the 4-hours chart of the BTC/USD pair.
The pair traded as low as $10,184 and it is currently correcting losses. It broke the 23.6% Fib retracement level of the recent decline from the $11,175 high to $10,184 low. However, the previous support near the $10,580 level is now acting as a strong resistance.
The next key resistance is near the $10,680 level or the 50% Fib retracement level of the recent decline from the $11,175 high to $10,184 low. The main resistance is near the $10,750 level and the 55 simple moving average (4-hours).
A clear break above the $10,580 level and then a follow up move above $10,750 is needed for a fresh increase. If not, there are chances of more losses below the $10,200 level.
The next major support is near the $10,000 level, below which bitcoin bears are likely to aim a larger decline towards the $9,500 level.
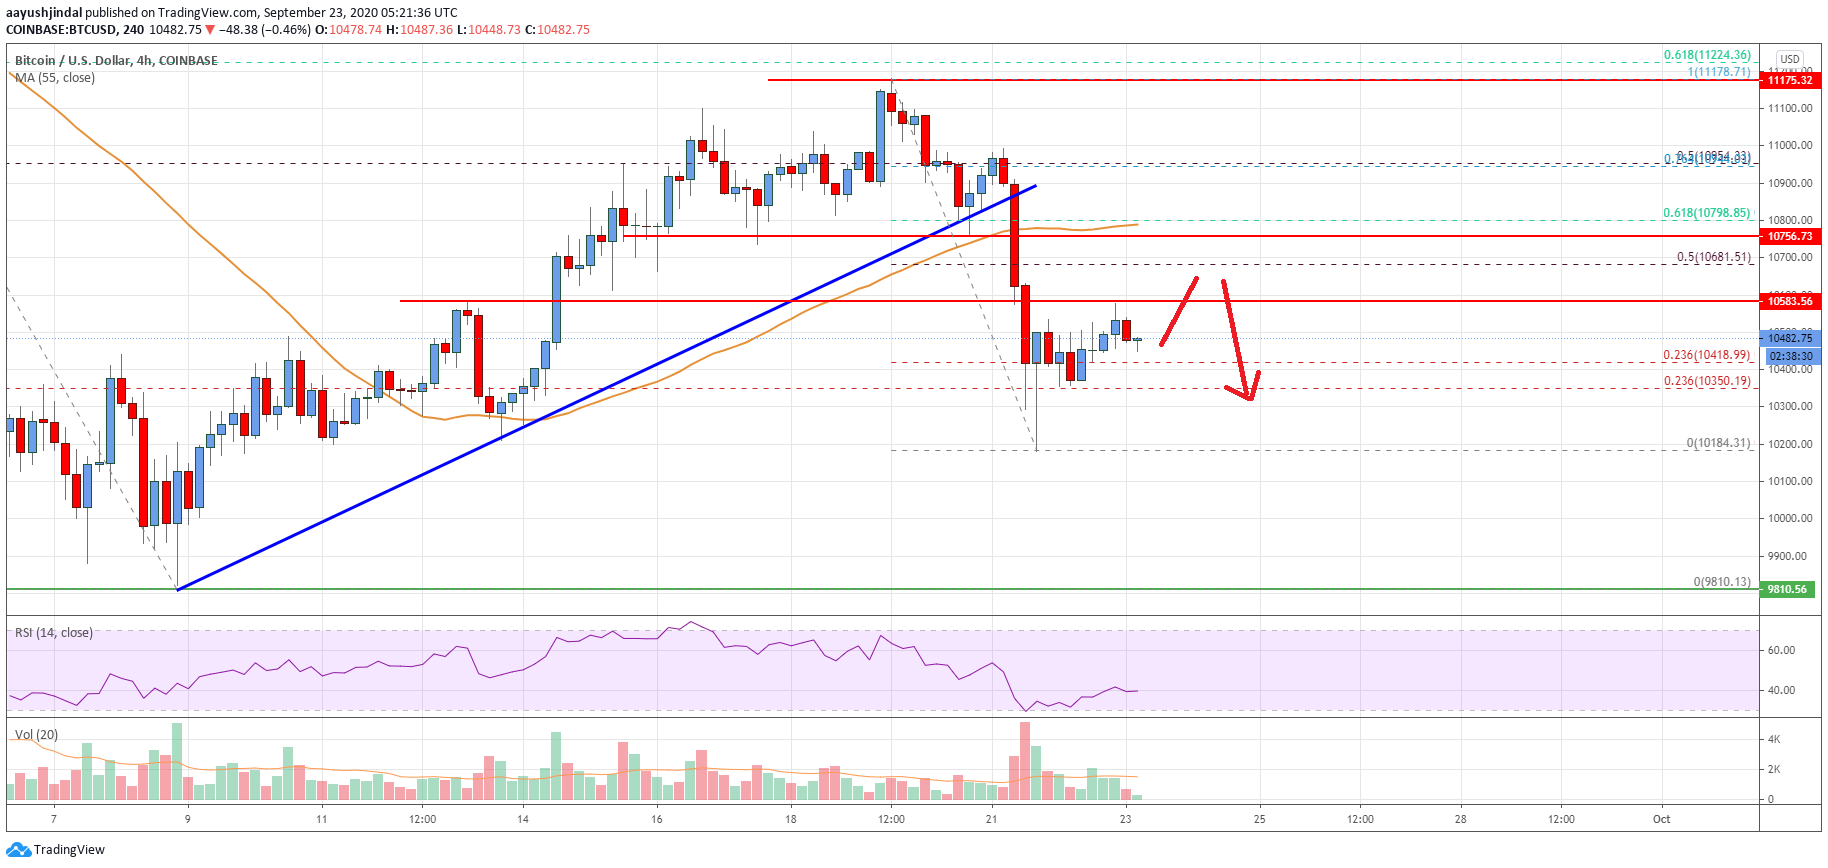
Looking at the chart, bitcoin price is now trading well below the $10,580 support level and the 55 SMA (H4). Overall, the price is likely to extend losses as long as it is below the $10,580 and $10,750 resistance levels in the near term.
Technical indicators
4 hours MACD – The MACD is struggling to gain pace in the bullish zone.
4 hours RSI (Relative Strength Index) – The RSI is now well below the 50 level.
Key Support Levels – $10,200 and $10,000.
Key Resistance Levels – $10,580, $10,680 and $10,750.