
- Bitcoin price found support near the $9,800 area and recently corrected higher.
- The price is trading above the $10,500 level and the 55 SMA (H4).
- There is a major rising channel forming with support near $10,560 on the 4-hours chart of the BTC/USD pair (data feed from Coinbase).
- The pair must break the $10,960 and $11,120 resistance levels to continue higher in the near term.
Bitcoin price is currently recovering higher above $10,500 against the US Dollar. BTC is likely to clear the $10,950 resistance as long as it is above the $10,560 support.
Bitcoin Price Analysis
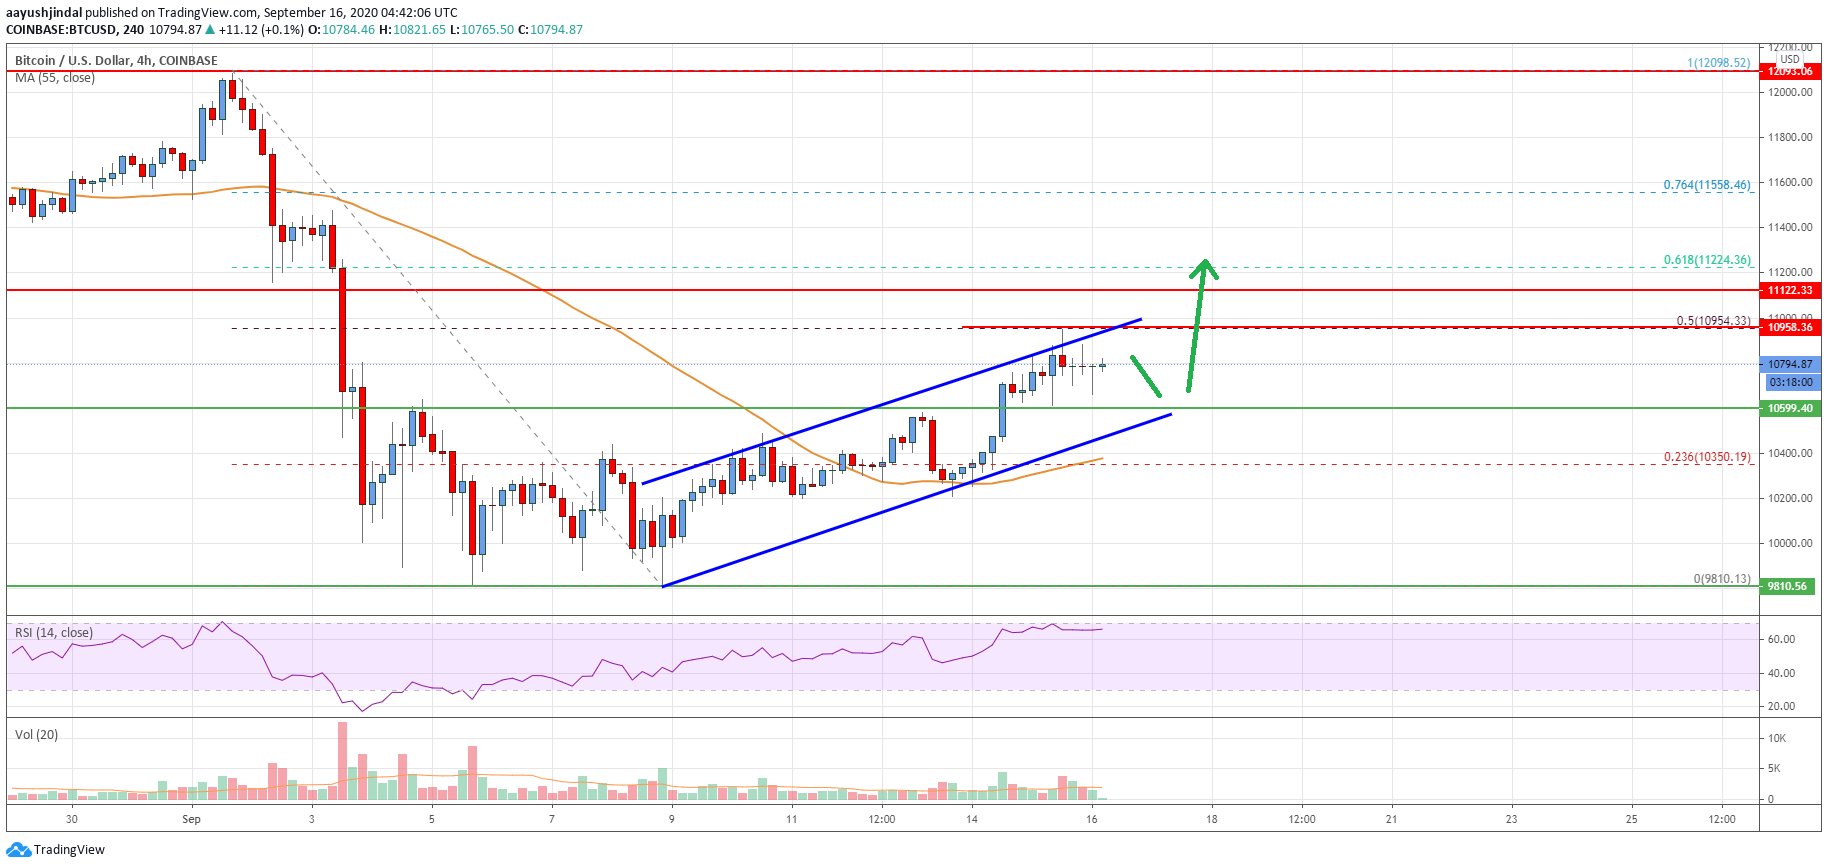
In the past few days, bitcoin price started a steady recovery wave from the $9,810 swing low against the US Dollar. BTC broke a couple of key hurdles near the $10,350 and $10,400 levels to move into a positive zone.
There was also a break above the $10,600 level and the 55 simple moving average (4-hours). The bulls pushed the price above the 23.6% Fib retracement level of the downward move from the $12,098 high to $9,810 low.
It even broke the $10,800 resistance, but it struggled to clear the $10,950 and $11,000 resistance levels. It seems like the price struggled to clear the 50% Fib retracement level of the downward move from the $12,098 high to $9,810 low.
A high is formed near $10,954 and the price is currently consolidating gains. On the downside, there is a key support forming near $10,600 and $10,560. There is also a major rising channel forming with support near $10,560 on the 4-hours chart of the BTC/USD pair.
The next major support is near the $10,350 level and the 55 simple moving average (4-hours). Any further losses may perhaps negate the chances of more gains and the price might decline towards the $10,000 support zone.
Conversely, the price could continue to rise above the $10,950 and $11,000 resistance levels. The next major hurdle is near the $11,120 level, above which the price may perhaps climb towards the $11,500 level.
Looking at the chart, bitcoin price is trading nicely above the $10,560 support zone and the 55 SMA (H4). Overall, the price must break the $10,960 and $11,120 resistance levels to continue higher in the near term.
Technical indicators
4 hours MACD – The MACD is showing positive signs in the bullish zone.
4 hours RSI (Relative Strength Index) – The RSI is now well above the 50 and 55 levels.
Key Support Levels – $10,560 and $10,350.
Key Resistance Levels – $10,950, $11,000 and $11,120.


Leave a Reply
You must be logged in to post a comment.