
- Bitcoin price is trading below the key $10,620 and $10,500 support levels.
- The price is struggling to stay above the $10,000 level and it is now well below the 55 SMA (H4).
- There is a key declining channel forming with resistance near $10,210 on the 4-hours chart of the BTC/USD pair (data feed from Coinbase).
- The pair could either start a steady increase above $10,210 or it might nosedive below $9,825.
Bitcoin price is currently trading in a bearish zone below $10,200 against the US Dollar. BTC remains at a risk of more losses as long as it is below $10,200 and $10,500.
Bitcoin Price Analysis
In the past few days, bitcoin price started a steady downward move below the $11,000 level against the US Dollar. BTC broke the key $10,620 support to move back into a negative zone.
The decline gained pace below the $10,500 level and the 55 simple moving average (4-hours). It even broke the $10,000 support and traded as low as $9,824. The price is currently consolidating losses and it is struggling to stay above the $10,000 level.
An initial resistance is near the $10,135 level since it is close to the 50% Fib retracement level of the recent decline from the $10,439 high to $9,824 low. The first major resistance is near the $10,200 area.
There is also a key declining channel forming with resistance near $10,210 on the 4-hours chart of the BTC/USD pair. If there is break above the channel resistance, the price could recover towards the main $10,620 level (support turned resistance).
The next major resistance is near the $10,800 level and the 55 simple moving average (4-hours), above which the price might move into a positive zone. Conversely, the price could continue to move down below $9,880 and $9,825.
The next major support is near the $9,650 level. Any further losses may perhaps lead the price towards the $9,500 support zone.
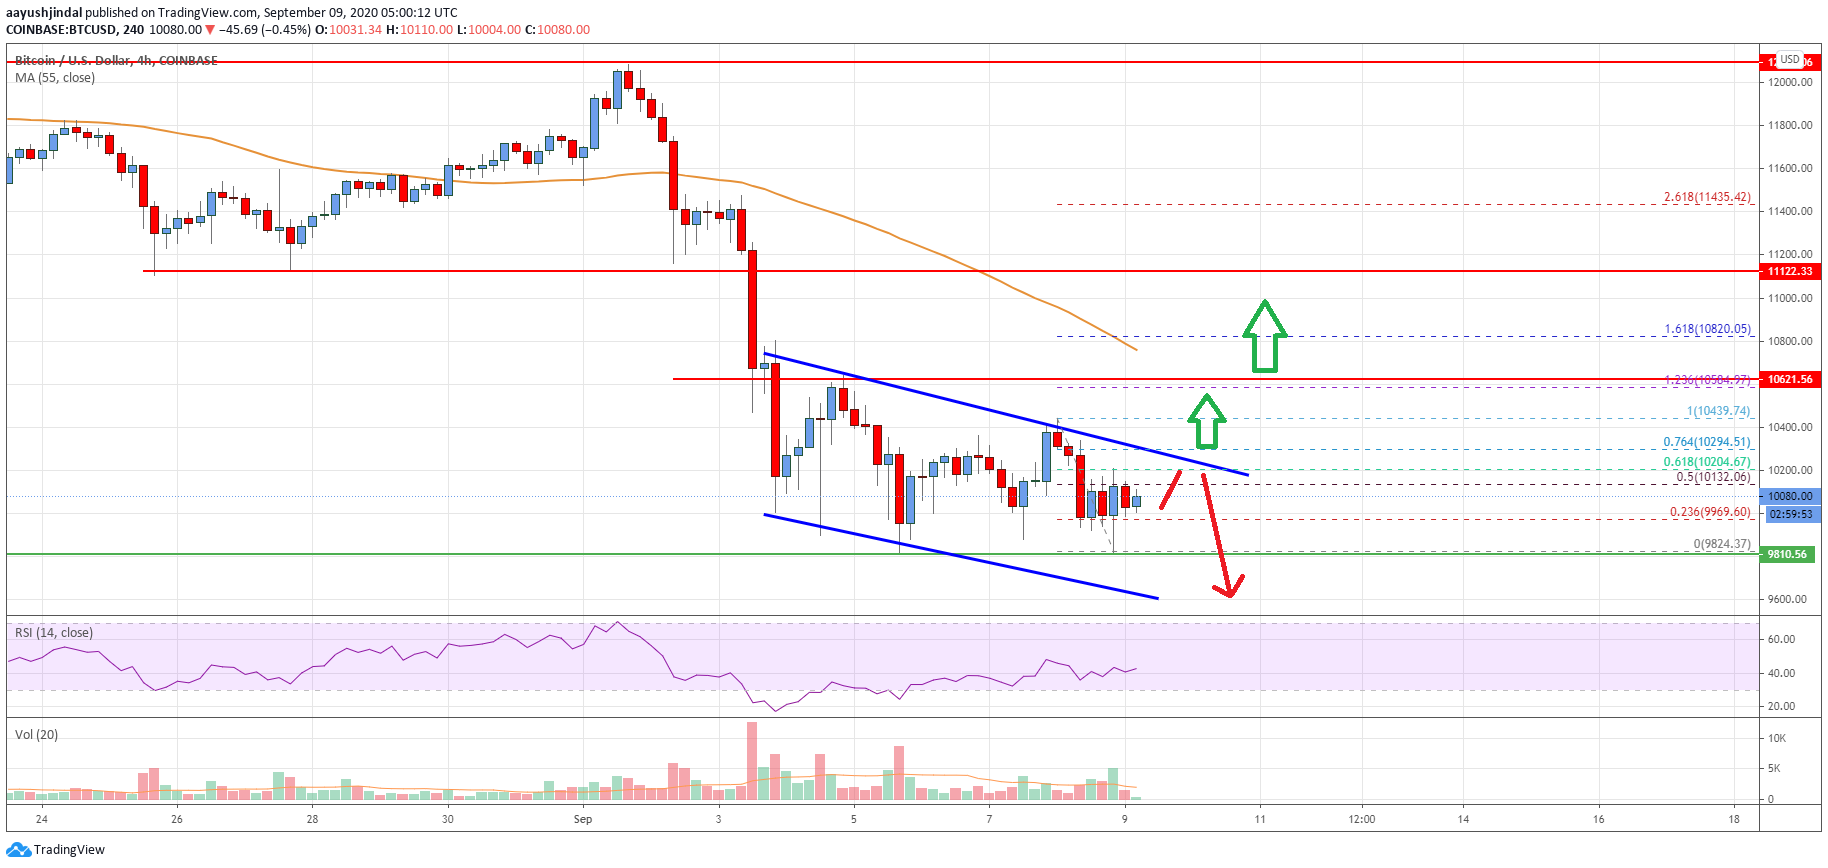
Looking at the chart, bitcoin price is clearly struggling to stay above the $10,000 level and it is now well below the 55 SMA (H4). Overall, the price could either start a steady increase above $10,210 or it might nosedive below $9,825 in the coming sessions.
Technical indicators
4 hours MACD – The MACD is slowly moving back into the bullish zone.
4 hours RSI (Relative Strength Index) – The RSI is correcting higher and approaching the 50 level.
Key Support Levels – $10,000 and $9,825.
Key Resistance Levels – $10,210, $10,500 and $10,620.


Leave a Reply
You must be logged in to post a comment.