- Bitcoin price declined heavily below the $11,800 and $11,500 support levels.
- The price traded as low as $11,101 and it is now well below the 55 SMA (H4).
- There is a key bearish trend line forming with resistance near $11,600 on the 4-hours chart of the BTC/USD pair (data feed from Coinbase).
- The pair remains at a risk of more downsides as long as it is below the $11,500 level.
Bitcoin price is currently trading in a bearish zone below $11,500 against the US Dollar. BTC could extend its losses below the $11,200 and $11,000 levels in the near term.
Bitcoin Price Analysis
This past week, bitcoin price started a steady decline from well above the $12,000 level against the US Dollar. BTC broke many key supports near $11,800 to move into a bearish zone.
There was also a close below the $11,500 level and the 55 simple moving average (4-hours). It even broke the $11,250 level and traded to a new weekly low at $11,101. It is currently correcting higher and trading above the $11,220 level.
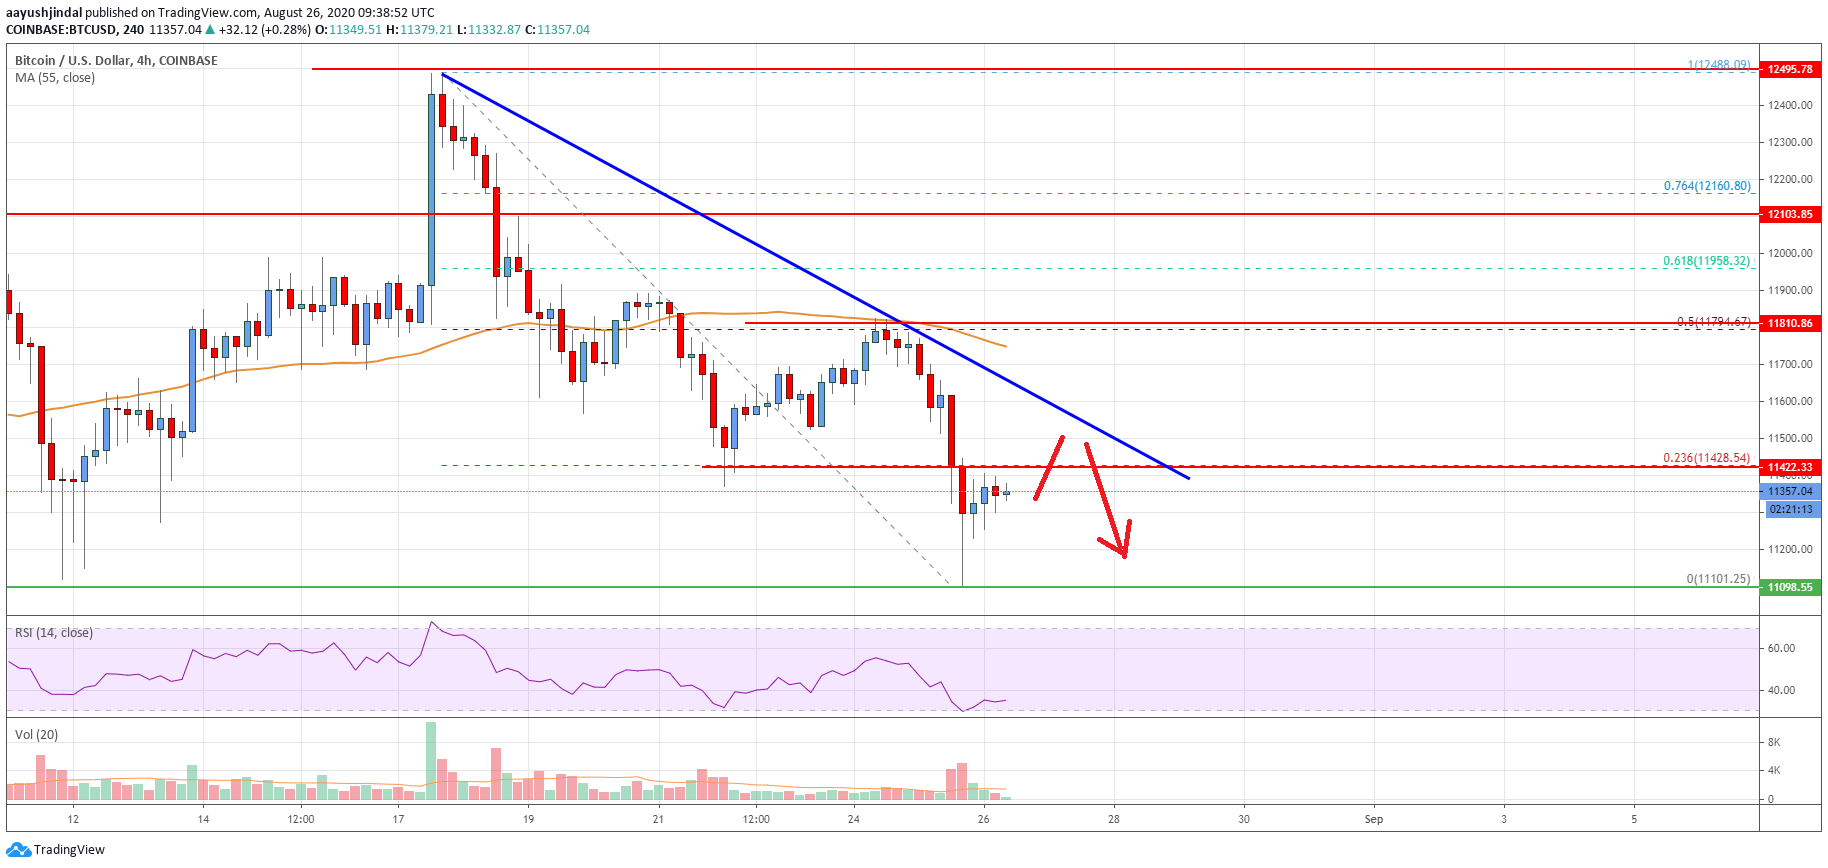
Bitcoin price is now facing hurdles near the $11,420 and $11,500 levels. There is also a key bearish trend line forming with resistance near $11,600 on the 4-hours chart of the BTC/USD pair.
The trend line is close to the 23.6% Fib retracement level of the recent decline from the $12,488 high to $11,101 low. If there is an upside break above the trend line resistance, the price could revisit the $11,800 resistance.
The 55 simple moving average (4-hours) is a major hurdle for the bulls near the $11,800 level. The 50% Fib retracement level of the recent decline from the $12,488 high to $11,101 low is also near the $11,794 level. Therefore, the price must surpass the $11,800 resistance to move into a bullish zone.
Conversely, there is a risk of more downsides below the $11,200 and $11,100 levels. The next support is near the $11,000 level, below which the bears are likely to aim a test of the $10,750 level.

Looking at the chart, bitcoin price is clearly correcting losses from the $11,100 support. Overall, the price remains at a risk of more downsides as long as it is below the $11,500 level.
Technical indicators
4 hours MACD – The MACD is slowly losing pace in the bearish zone.
4 hours RSI (Relative Strength Index) – The RSI is now well below the 50 level.
Key Support Levels – $11,200 and $11,100.
Key Resistance Levels – $11,420, $11,500 and $11,800.


Leave a Reply
You must be logged in to post a comment.