- Bitcoin price is holding a couple of important supports near the $11,200 level.
- The price is slowly rising, but it struggling to clear $11,600 and the 55 SMA (H4).
- There is a key bullish trend line forming with support near $11,200 on the 4-hours chart of the BTC/USD pair (data feed from Coinbase).
- The pair must clear the 55 SMA and the $11,600 resistance to restart its rally in the near term.
Bitcoin price is showing a few positive signs above $11,000 against the US Dollar. However, BTC must surpass the $11,600 resistance zone to continue higher towards $12,000.
Bitcoin Price Analysis
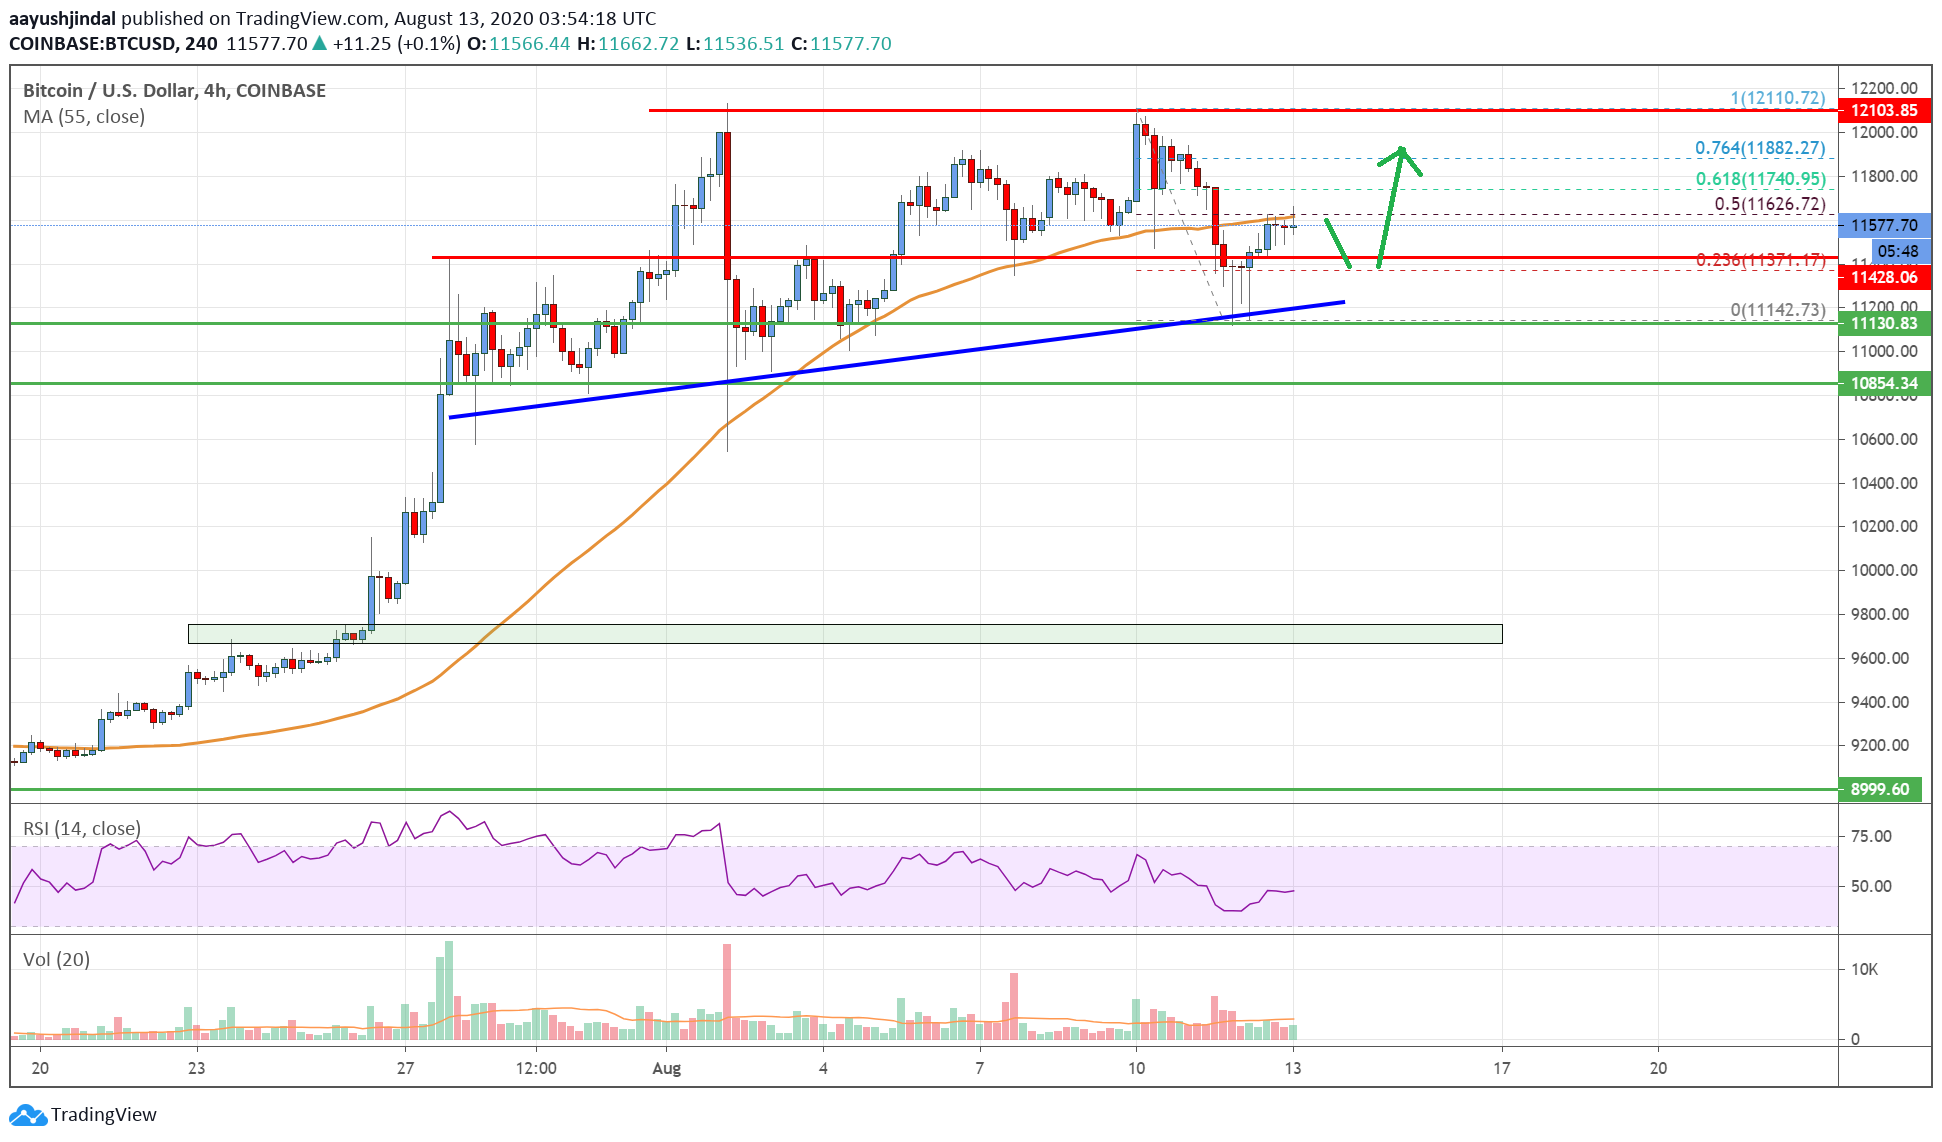
This past week, bitcoin price struggled to gain momentum above the $12,000 and $12,100 levels against the US Dollar. As a result, BTC reacted to the downside and broke the $11,600 support level.
The price even traded below the $11,500 support level and settled below the 55 simple moving average (4-hours). It tested the $11,200 support zone and a swing low was formed near $11,142. Recently, the price started an upside correction and climbed above the $11,400 level.
There was a break above the 23.6% Fib retracement level of the downward correction from the $12,110 high to $11,142 swing low. It is now facing a major resistance near the $11,600 zone and the 55 simple moving average (4-hours).
The bulls are also struggling to clear the 50% Fib retracement level of the downward correction from the $12,110 high to $11,142 swing low. If they succeed, the price could start a strong wave towards the $12,000 resistance zone in the near term.
Any further gains could open the doors for a larger upward move towards the $12,400 level. Conversely, the price might fail to clear the $11,600 barrier and the 55 SMA.
On the downside, there is a key bullish trend line forming with support near $11,200 on the 4-hours chart of the BTC/USD pair. If the price breaks the trend line support, there is a risk of a larger decline towards the $10,850 support.

Looking at the chart, bitcoin price is clearly trading above a couple of important supports near $11,200. Still, must clear the 55 SMA and the $11,600 resistance to restart its rally in the near term.
Technical indicators
4 hours MACD – The MACD is slowly gaining pace in the bullish zone.
4 hours RSI (Relative Strength Index) – The RSI is currently close to the 50 level.
Key Support Levels – $11,200 and $10,850.
Key Resistance Levels – $11,600, $12,000 and $12,100.


Leave a Reply
You must be logged in to post a comment.