
- Bitcoin price is facing a strong resistance near $10,900 and $11,000 against the US Dollar.
- The price is holding the $10,600 support level and the 55 SMA (H4).
- There is a key breakout pattern forming with support near $10,600 on the 4-hours chart of the BTC/USD pair (data feed from Coinbase).
- The pair is likely to decline sharply if there is a break below the $10,600 and $10,500 support levels.
Bitcoin price is currently trading in a range above the $10,500 support against the US Dollar. BTC could either rally above $11,000 or decline heavily below $10,500.
Bitcoin Price Analysis
After forming a base above $10,180, bitcoin price started a decent upward move against the US Dollar. BTC broke a couple of important hurdles near $10,500 and $10,550 to move into a positive zone.
There was also a close above the $10,550 level and the 55 simple moving average (4-hours). However, the price is facing a strong resistance near $10,900 and $11,000. A high is formed near $10,961 and the price is currently trading in a range.
There was a break below the 23.6% Fib retracement level of the upward move from the $10,141 swing low to $10,961 high. The price is now holding the $10,600 support level and the 55 SMA (H4).
It seems like there is a key breakout pattern forming with support near $10,600 on the 4-hours chart of the BTC/USD pair. If there is a downside break, the price might test the $10,555 support level. It is close to the 50% Fib retracement level of the upward move from the $10,141 swing low to $10,961 high.
A successful close below the $10,555 and $10,500 support level could lead the price back towards the $10,200 support level. The next major support is near the $10,000 level.
Conversely, bitcoin price might clear the triangle resistance and $10,961 high to continue higher. The main resistance is near the $11,050 level, above which the price could rise towards the $11,450 and $11,500 levels.
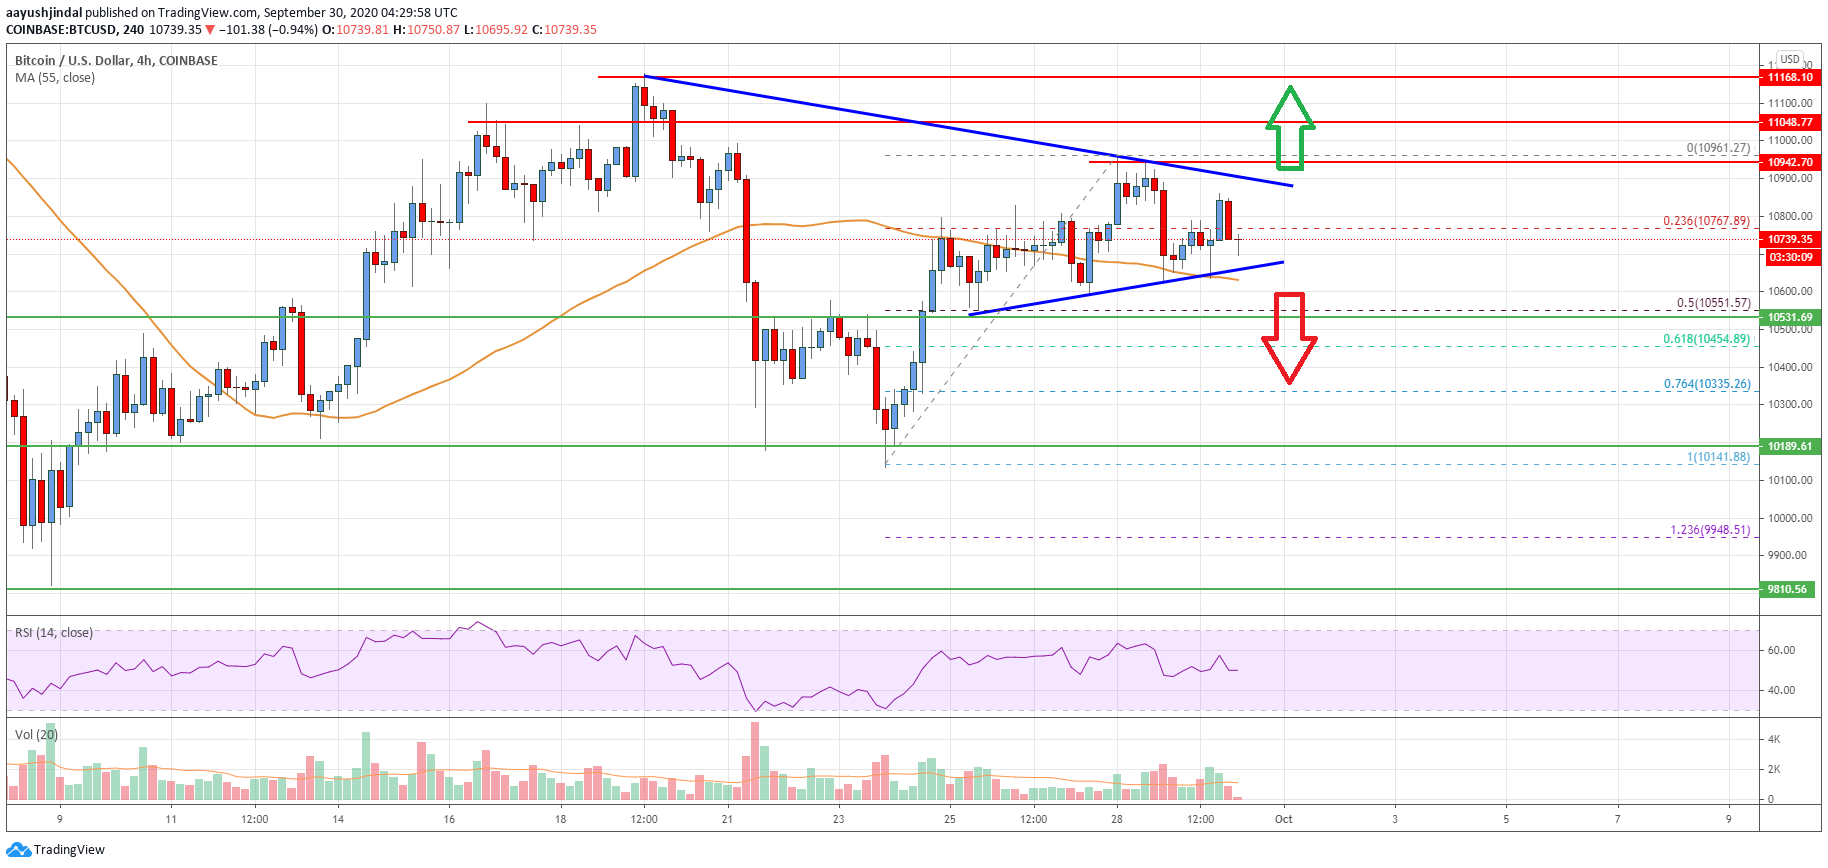
Looking at the chart, bitcoin price is clearly consolidating above the $10,555 support level and the 55 SMA (H4). Having said that, the price could decline sharply if there is a break below the $10,600 and $10,500 support levels.
Technical indicators
4 hours MACD – The MACD is struggling to gain pace in the bullish zone.
4 hours RSI (Relative Strength Index) – The RSI is now just above the 50 level.
Key Support Levels – $10,600 and $10,555.
Key Resistance Levels – $10,900, $11,050 and $11,165.


Leave a Reply
You must be logged in to post a comment.