- Bitcoin price started a downside correction from the $43,850 zone against the US Dollar.
- The price is now trading above $42,800 and the 55 simple moving average (4 hours).
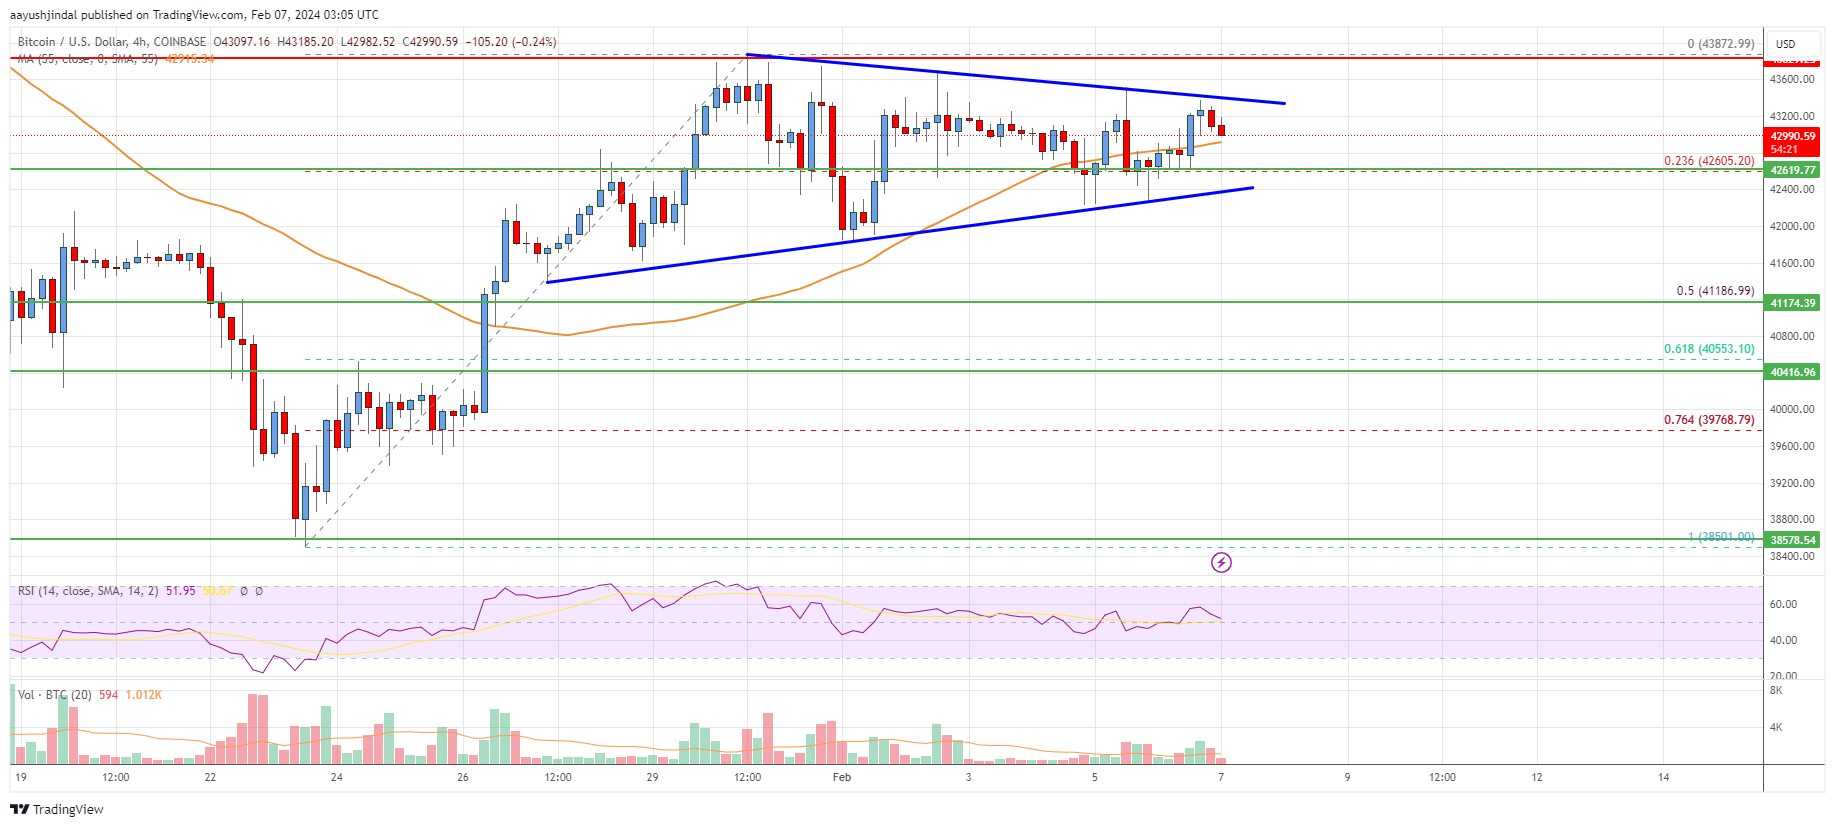
- There is a key contracting triangle forming with resistance near $43,320 on the 4-hour chart of the BTC/USD pair (data feed from Coinbase).
- The pair could start a fresh increase if it stays above the $42,200 support zone.
Bitcoin price is correcting lower below $43,500 against the US Dollar. BTC might eye another increase if the bulls remain active above the $42,200 zone.
Bitcoin Price Analysis
Bitcoin price extended its increase above the $43,000 level and rallied toward the $44,000 resistance zone. A high was formed near $43,872 before the price started a downside correction. There was a clear move below the $43,500 and $43,200 levels.
The bears were able to push the price below the 23.6% Fib retracement level of the upward move from the $38,501 swing low to the $43,872 high. The price even spiked below $42,200.
Bitcoin is now trading above $42,800 and the 55 simple moving average (4 hours). There is also a key contracting triangle forming with resistance near $43,320 on the 4-hour chart of the BTC/USD pair. Immediate resistance on the upside is near the $43,320 level.
The next major resistance might be near the $43,500 zone. A clear move above the $43,500 level might send the price toward $44,500, above which the price might rise toward the $45,000 level. Any more gains might push the price toward the $46,500 zone.
If there is no upside break, the price might continue to decline below the $42,600 level. The first major support is $41,200 or the 50% Fib retracement level of the upward move from the $38,501 swing low to the $43,872 high.
The next key support is near the $40,500 level, below which the price might accelerate lower. In the stated case, the price could decline toward the $38,500 level. Any more losses might send the price toward the $36,000 level.

Looking at the chart, Bitcoin price is clearly trading above $42,500 and the 55 simple moving average (4 hours). Overall, the price could start a fresh increase if it stays above the $42,200 support zone.
Technical Indicators
4 hours MACD – The MACD is now losing momentum in the bullish zone.
4 hours RSI (Relative Strength Index) – The RSI is now above the 50 level.
Key Support Levels – $42,600 and $41,200.
Key Resistance Levels – $43,320, $43,500, and $44,500.


