- Solana price started a downside correction from the $106 zone against the US Dollar.
- The price is now trading below $100 and the 55 simple moving average (4 hours).
- There is a key bearish trend line forming with resistance near $97 on the 4-hour chart of the SOL/USD pair (data feed from Coinbase).
- The pair must stay above the $92 and $89 support levels to start another increase.
Solana price is trading above $92 against the US Dollar, like Bitcoin. SOL is consolidating gains and might start a fresh increase above $106.
Solana (SOL) Price Analysis
SOL price attempted more upsides above the $92 resistance zone. The price climbed above the $100 zone, but the bears were active near the $105 zone.
A high was formed near $106.45 before there was a downside correction. The price declined below the $100 support zone. The bears were able to push the price below the 23.6% Fib retracement level of the upward wave from the $78.14 swing low to the $106.45 high.
It is now trading below $100 and the 55 simple moving average (4 hours). On the downside, initial support is near the $94 level. The next major support is near the $92 level. It is close to the 50% Fib retracement level of the upward wave from the $78.14 swing low to the $106.45 high.
A downside break below the $92 support level might spark a sharp decline. In the stated case, the price may perhaps decline toward the $84 level. Any more losses might call for a test of $78.
On the upside, immediate resistance is near the $97 level. The next major resistance is near the $105 zone. Any more gains might send SOL price toward the $120 resistance zone, above which the price could accelerate higher. The next major resistance sits near the $125 level.
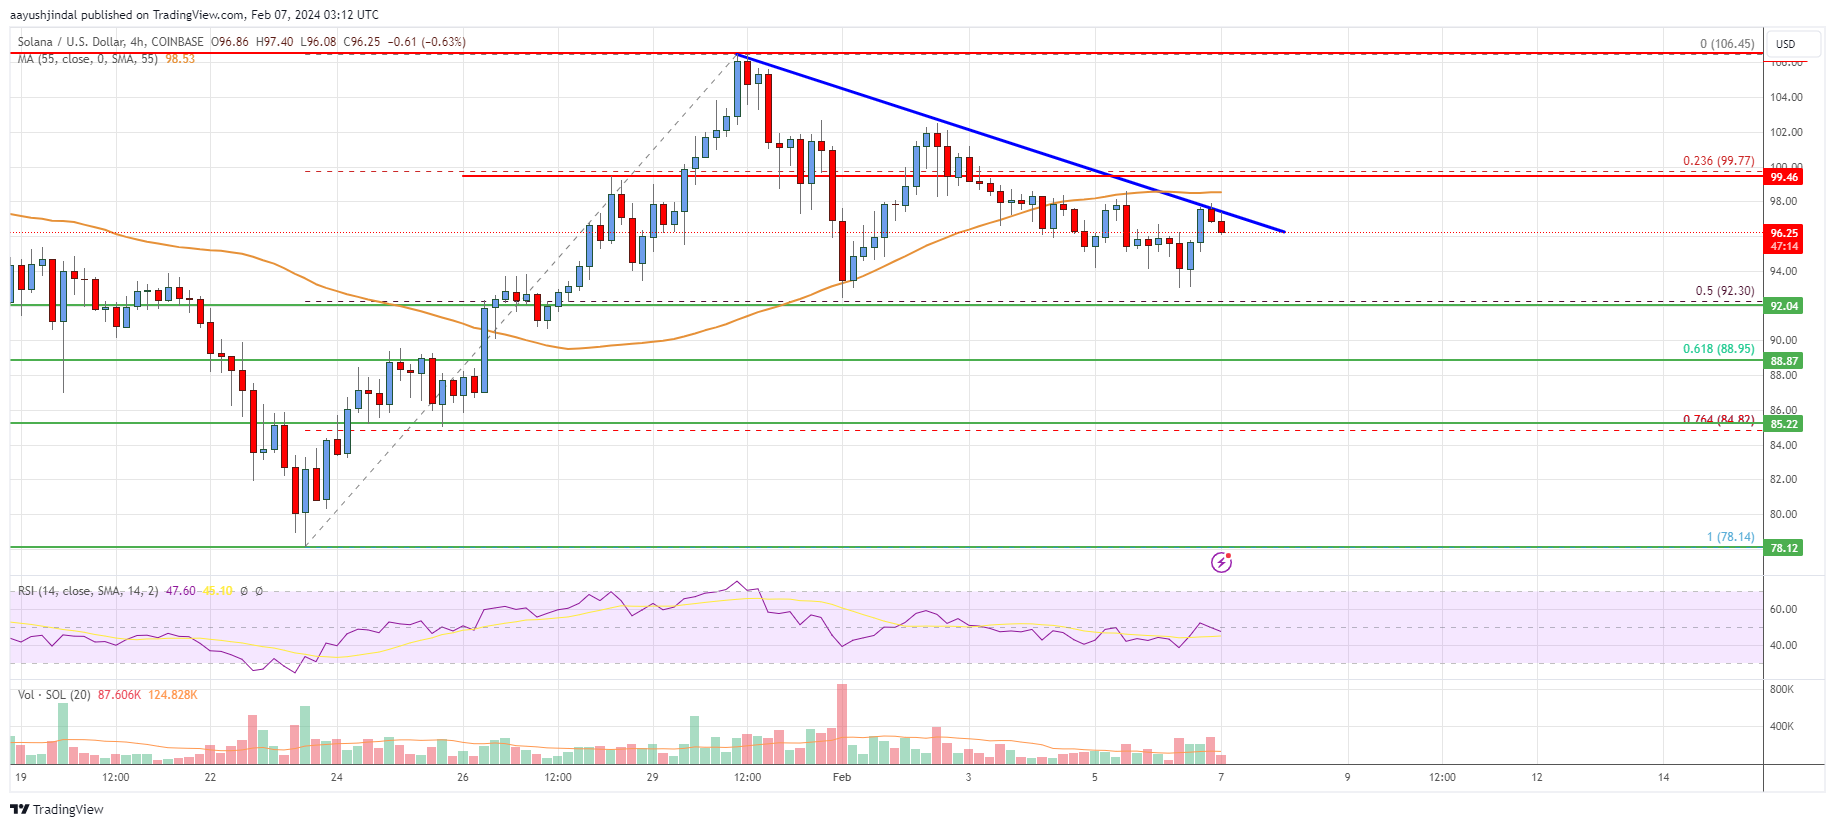
Looking at the chart, Solana price is clearly trading below $100 and the 55 simple moving average (4 hours). Overall, the price must stay above the $92 and $89 support levels to start another increase.
Technical Indicators
4 hours MACD – The MACD is now losing momentum in the bearish zone.
4 hours RSI (Relative Strength Index) – The RSI is now below the 50 level.
Key Support Levels – $92 and $89.
Key Resistance Levels – $97, $105, and $120.