
- Bitcoin price started a downside correction from well above the $64,000 zone against the US Dollar.
- The price is now trading below $62,000 and the 55 simple moving average (4-hours).
- There was a break below a key bullish trend line with support near $63,000 on the 4-hours chart of the BTC/USD pair (data feed from Coinbase).
- The pair could continue to move down if there is a break below $59,500.
Bitcoin price is back below the $62,000 pivot level against the US Dollar. BTC remains at a risk of more losses below the $60,000 level in the near term.
Bitcoin Price Analysis
Bitcoin price remained in a positive zone above the $60,000 level. As a result, BTC started a fresh increase above the $62,000 and $64,000 resistance levels.
The price gained pace for a move above the $65,000 level and the 55 simple moving average (4-hours). The price traded as high as $66,999 before it started a fresh decline. There was a break below the $65,000 level and the $64,200 support zone.
Bitcoin even settled below the $62,000 support and the 55 simple moving average (4-hours). There was a break below a key bullish trend line with support near $63,000 on the 4-hours chart of the BTC/USD pair.
The price even spiked below $60,000 and it is now consolidating losses. It is testing the 23.6% Fib retracement level of the recent decline from the $66,999 high to $59,522 low. On the upside, an initial resistance is near the $62,250 level and the 55 simple moving average (4-hours).
The main resistance is forming near the $63,500 zone. A close above the $63,500 zone is needed for a fresh increase. In the stated case, the price is likely to rise steadily towards the 65,000 level.
On the downside, an initial support is near the $60,400 level. The main breakdown support is forming near the $59,500 level, below which the price could decline towards the $58,000 level.
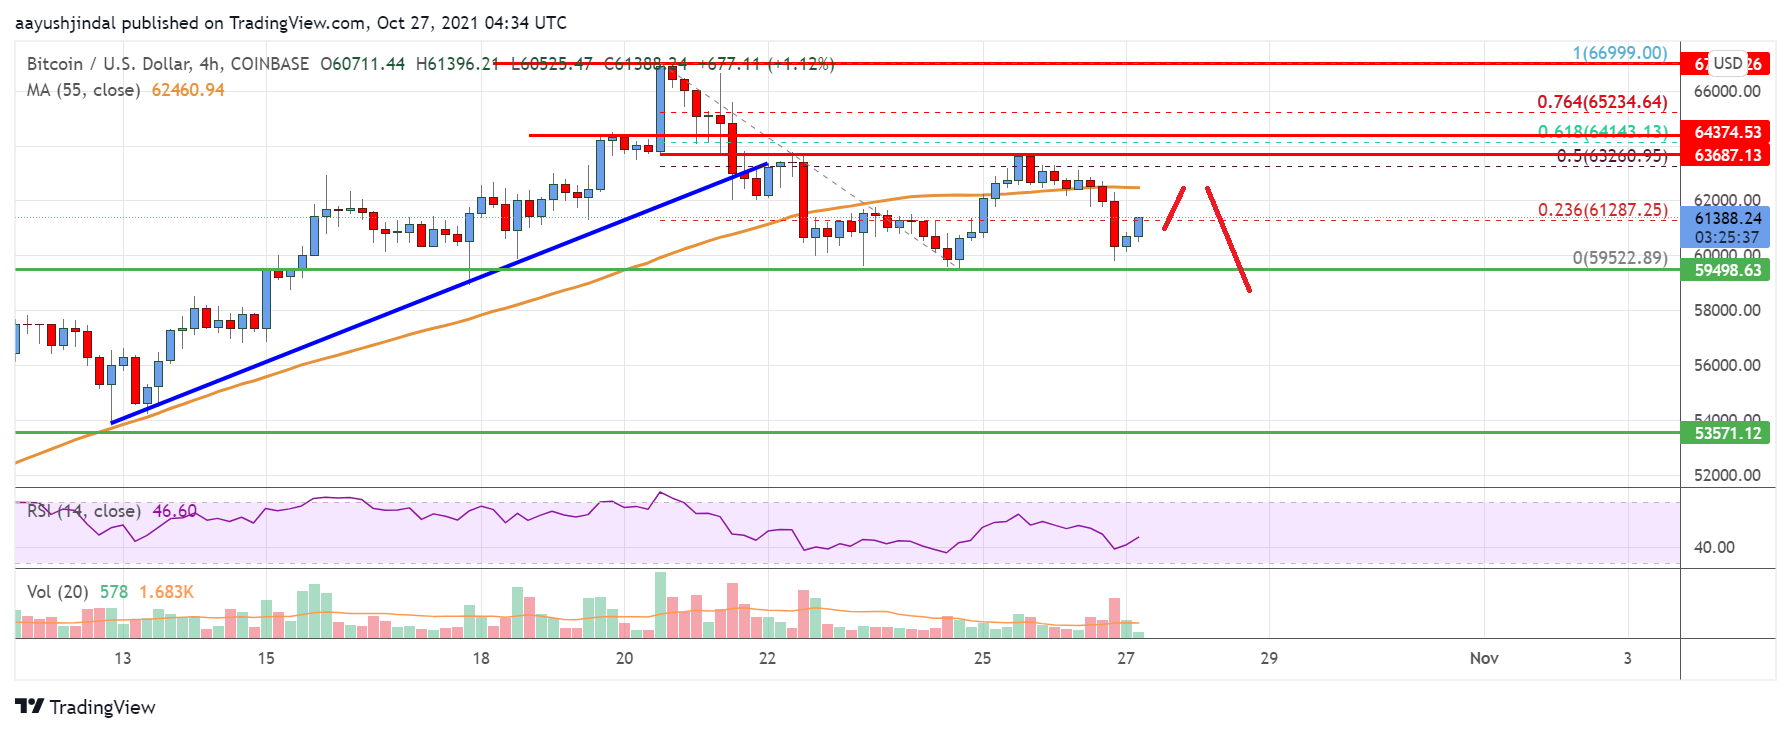
Looking at the chart, bitcoin price is clearly trading below $62,000 and the 55 simple moving average (4-hours). Overall, the price could accelerate lower if it breaks the $59,500 support.
Technical indicators
4 hours MACD – The MACD is now losing momentum in the bearish zone.
4 hours RSI (Relative Strength Index) – The RSI is just below the 50 level.
Key Support Levels – $60,000 and $59,500.
Key Resistance Levels – $62,000, $62,250 and $63,500.


Leave a Reply
You must be logged in to post a comment.