Key Points
- Bitcoin price broke the key $3,360 and $3,570 resistance levels against the US Dollar.
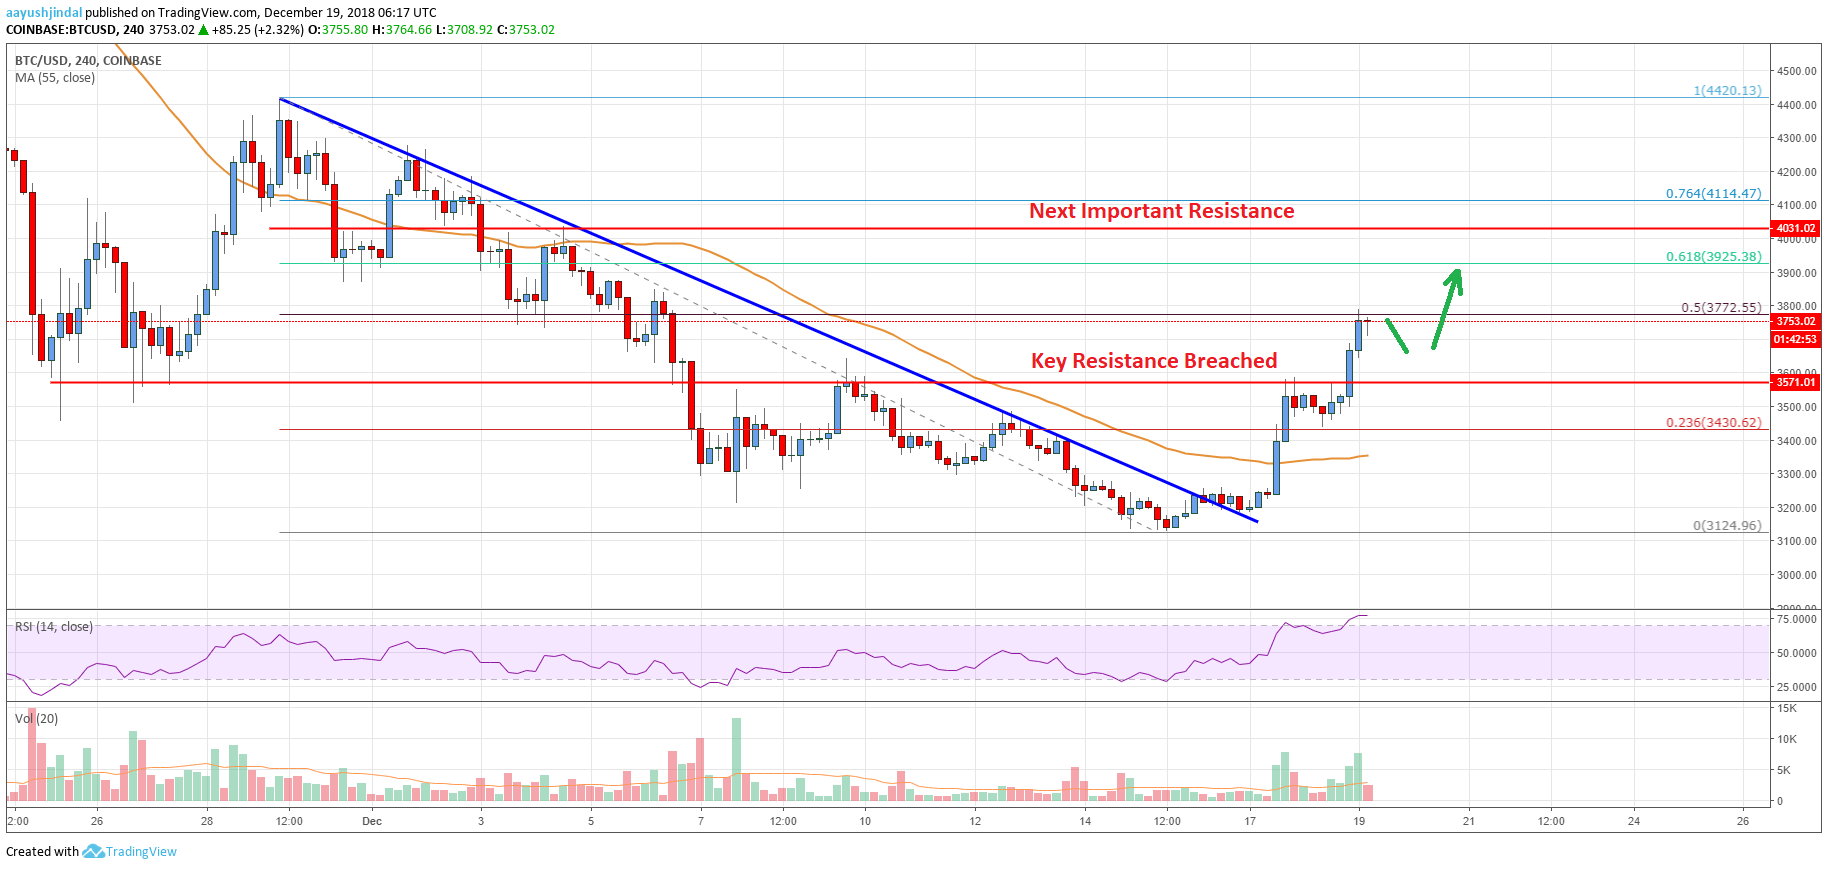
- There was a break above a significant bearish trend line with resistance near $3,200 on the 4-hours chart of the BTC/USD pair (data feed from Coinbase).
- The price could extend the current wave towards $3,925 or $4,030 in the near term.
Bitcoin price started a fresh bullish wave from $3,124 and climbed above $3,570 against the US Dollar. BTC is likely to gain pace towards $3,925 or $4,030 in the coming days.
Bitcoin Price Analysis
There was a solid support formed near the $3,124-3,125 zone in bitcoin price against the US Dollar. The BTC/USD pair started a fresh bullish wave and broke the $3,200 and $3,400 resistance levels. Besides, there was a close above the $3,500 resistance and the 55 simple moving average (4-hours). The price rallied above the 23.6% Fib retracement level of the last major drop from the $4,420 high to $3,124 low.
More importantly, there was a break above a significant bearish trend line with resistance near $3,200 on the 4-hours chart of the BTC/USD pair. The pair finally cleared the $3,570 resistance area, which was a solid support earlier. At the outset, the price is testing the 50% Fib retracement level of the last major drop from the $4,420 high to $3,124 low. A break above the $3,770-3,780 zone could open the doors for more gains above the $3,850 level. The next stop for buyers could be $3,925 (the 61.8% Fib level). However, the main hurdle is near the $4,000-4,030 zone.

Looking at the chart, bitcoin price clearly moved into a bullish above $3,570. However, a break above $3,780 and $3,925 won’t be easy in the near term. The key supports are $3,620 and $3,570.
Looking at the technical indicators:
4-hour MACD – The MACD for BTC/USD is placed nicely in the bullish zone.
4-hour RSI (Relative Strength Index) – The RSI is currently in the overbought zone.
Key Support Level – $3,570
Key Resistance Level – $3,780


Leave a Reply
You must be logged in to post a comment.