
- Bitcoin price is attempting a fresh increase from the $25,500 zone against the US Dollar.
- The price is now trading near $27,000 and the 55 simple moving average (4 hours).
- There was a break above a key bearish trend line with resistance near $26,900 on the 4-hour chart of the BTC/USD pair (data feed from Coinbase).
- The pair could start a fresh increase if it clears the $27,350 resistance zone.
Bitcoin price is rising from $25,500 against the US Dollar. BTC might eye another increase if the bulls remain active above the $26,550 zone.
Bitcoin Price Analysis
Bitcoin price remained well-bid above the $25,500 level. A base was formed and the price was able to settle above the $26,000 resistance zone. The bulls remained active above $26,000 and initiated a decent increase.
There was a move above the 50% Fib retracement level of the key decline from the $28,431 swing high to the $25,351 low. Besides, there was a break above a key bearish trend line with resistance near $26,900 on the 4-hour chart of the BTC/USD pair.
Bitcoin price is now trading near $27,000 and the 55 simple moving average (4 hours). Immediate resistance on the upside is near the $27,350 level.
The next major resistance might be near the $27,700 zone or the 76.4% Fib retracement level of the key decline from the $28,431 swing high to the $25,351 low. A clear move above the $27,350 and $27,700 resistance levels might send the price toward $28,500.
Any more gains might push the price toward the $29,500 zone. If there is no upside break, the price might start a fresh decline below the $26,800 level and the 55 simple moving average (4 hours).
The first major support is near $26,550. The next key support is near the $26,000 level, below which the price might accelerate lower. In the stated case, the price could decline toward the $25,500 level in the coming sessions.
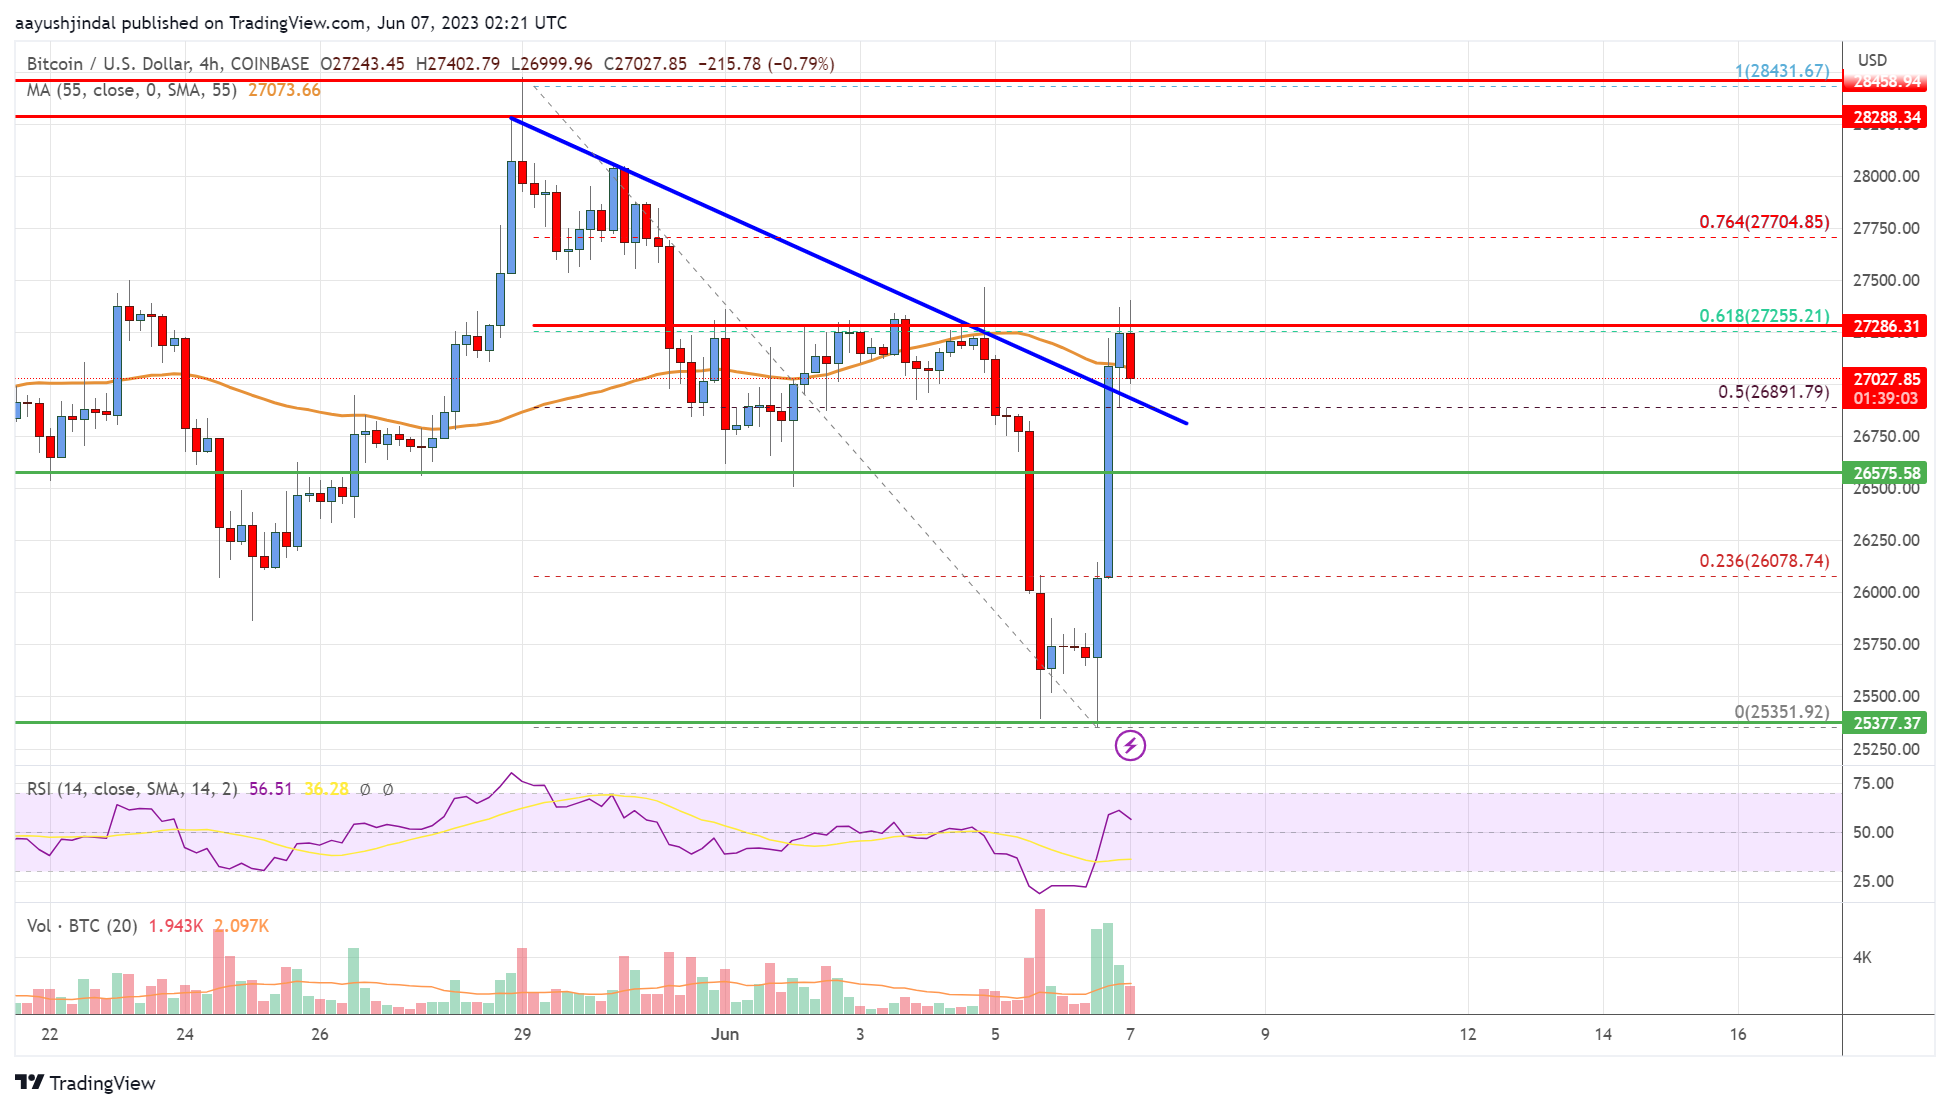
Looking at the chart, Bitcoin’s price is trading near $27,000 and the 55 simple moving average (4 hours). Overall, the price could start a fresh increase if it clears the $27,350 resistance zone.
Technical Indicators
4 hours MACD – The MACD is now losing momentum in the bullish zone.
4 hours RSI (Relative Strength Index) – The RSI is now above the 50 level.
Key Support Levels – $26,550 and $26,000.
Key Resistance Levels – $27,350, $27,700, and $28,500.


Leave a Reply
You must be logged in to post a comment.