- Tron price started a fresh downside correction from the $0.0855 zone against the US Dollar.
- TRX price is now trading above $0.0770 and the 55 simple moving average (4 hours).
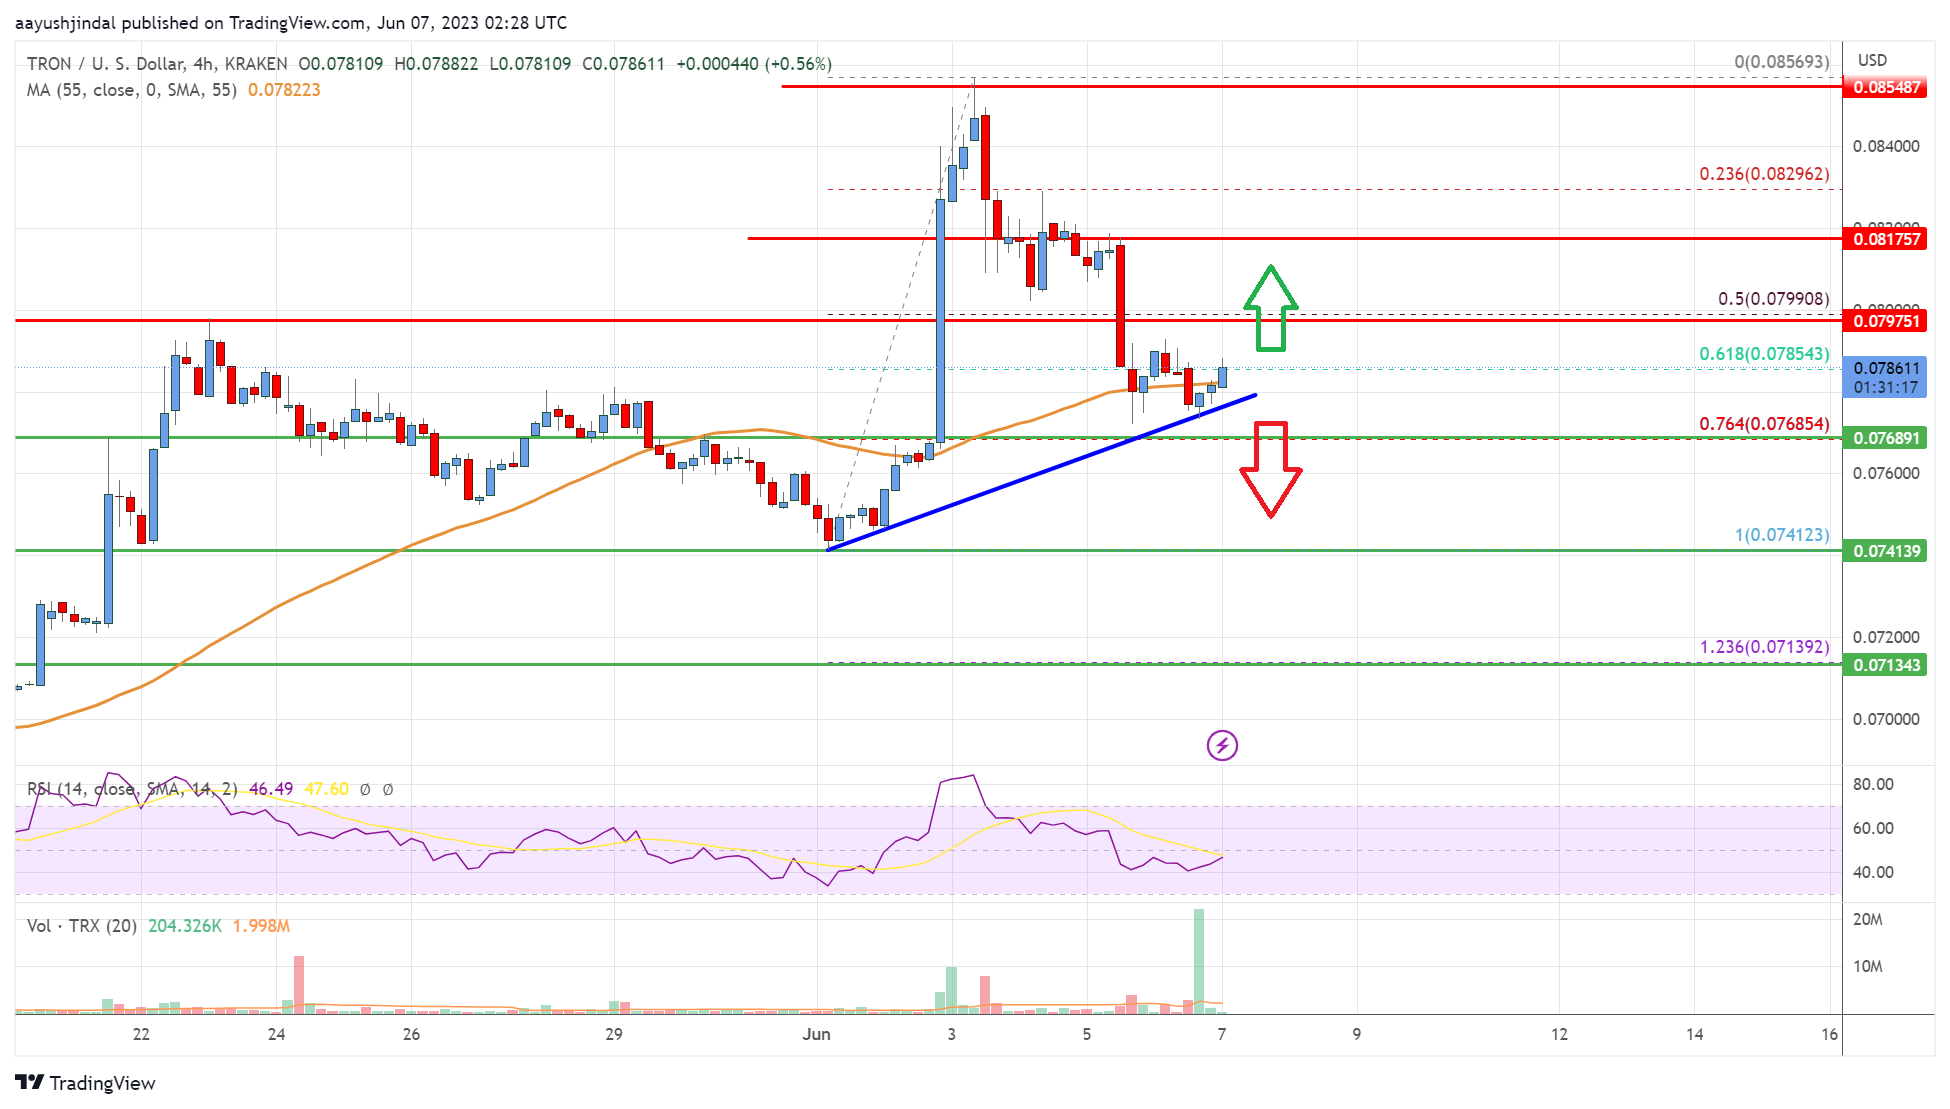
- There is a key bullish trend line forming with support near $0.0777 on the 4-hour chart (data feed via Kraken).
- The pair could continue to move down if it breaks the $0.0768 support zone.
TRON price started a fresh decline below the $0.0820 zone against the US Dollar, similar to Bitcoin. TRX price could accelerate lower if there is a move below $0.0768.
Tron Price Analysis
This past week, Tron price started a steady increase above the $0.0750 resistance level against the US Dollar. TRX price struggled to gain pace for more gains and formed a top near $0.0855.
The price started a fresh decline below the $0.0820 level. There was a move below the 50% Fib retracement level of the upward move from the $0.0741 swing low to the $0.0856 high. However, the bulls were active near the $0.0770 level.
There is also a key bullish trend line forming with support near $0.0777 on the 4-hour chart. The price is now trading above $0.0770 and the 55 simple moving average (4 hours). On the upside, TRX is facing resistance near the $0.0800 level.
The first major resistance is near the $0.082 level. A close above $0.082 is a must for a fresh increase. In the stated case, the price could rise toward the $0.0855 resistance in the near term.
On the downside, initial support is near the $0.0777 level and the trend line. The next major support is now forming near $0.0768. It is near the 76.4% Fib retracement level of the upward move from the $0.0741 swing low to the $0.0856 high.
If there is a downside break below the $0.0768 support, the price might revisit the $0.0720 support. Any more losses might call for a move toward the $0.0700 zone in the near term.

The chart indicates that TRX price is now trading above $0.0770 and near the 55 simple moving average (4 hours). Overall, the price could continue to move down if it breaks the $0.0768 support zone.
Technical Indicators
4 hours MACD – The MACD for TRX/USD is slowly losing momentum in the bearish zone.
4 hours RSI – The RSI for TRX/USD is above the 50 level.
Key Support Levels – $0.0768 and $0.0720.
Key Resistance Levels – $0.080, $0.082, and $0.0855.


Leave a Reply
You must be logged in to post a comment.