
- Tron price started a fresh increase above the $0.0720 level against the US Dollar.
- TRX price is now trading below $0.0780 and the 55 simple moving average (4 hours).
- There is a major bullish trend line forming with support near $0.0752 on the 4-hours chart (data feed via Kraken).
- The pair could continue to move up if it breaks the $0.0780 resistance zone.
TRON price started a fresh increase above $0.0720 against the US Dollar, similar to Bitcoin. TRX’s price could rise further if it clears the $0.0780 resistance.
Tron Price Analysis
In the past few days, Tron price started a steady increase from the $0.0712 support zone against the US Dollar. TRX’s price remained well-bid and was able to climb above the $0.0755 zone.
It traded above the $0.0780 and $0.0788 levels to move further into a positive zone. Finally, the bears appeared near the $0.080 level. A high is formed near $0.0798 and the price is now correcting gains. There was a move below the 23.6% Fib retracement level of the upward wave from the $0.0669 swing low to the $0.0798 high.
It is trading below $0.0780 and the 55 simple moving average (4 hours). On the upside, TRX is facing resistance near the $0.0770 level. The next major resistance is near the $0.078 level.
A close above $0.078 could send the price toward the $0.0800 resistance zone. Any more gains might send TRX price toward $0.0825, above which the price could even rise toward $0.085. On the downside, initial support is near the $0.0752 level.
There is also a major bullish trend line forming with support near $0.0752 on the 4-hours chart. The next major support is now forming near $0.0718 or the 61.8% Fib retracement level of the upward wave from the $0.0669 swing low to the $0.0798 high.
If there is a downside break below the $0.0718 support, the price might revisit the $0.0700 support. Any more losses might call for a move toward the $0.0665 zone in the near term.
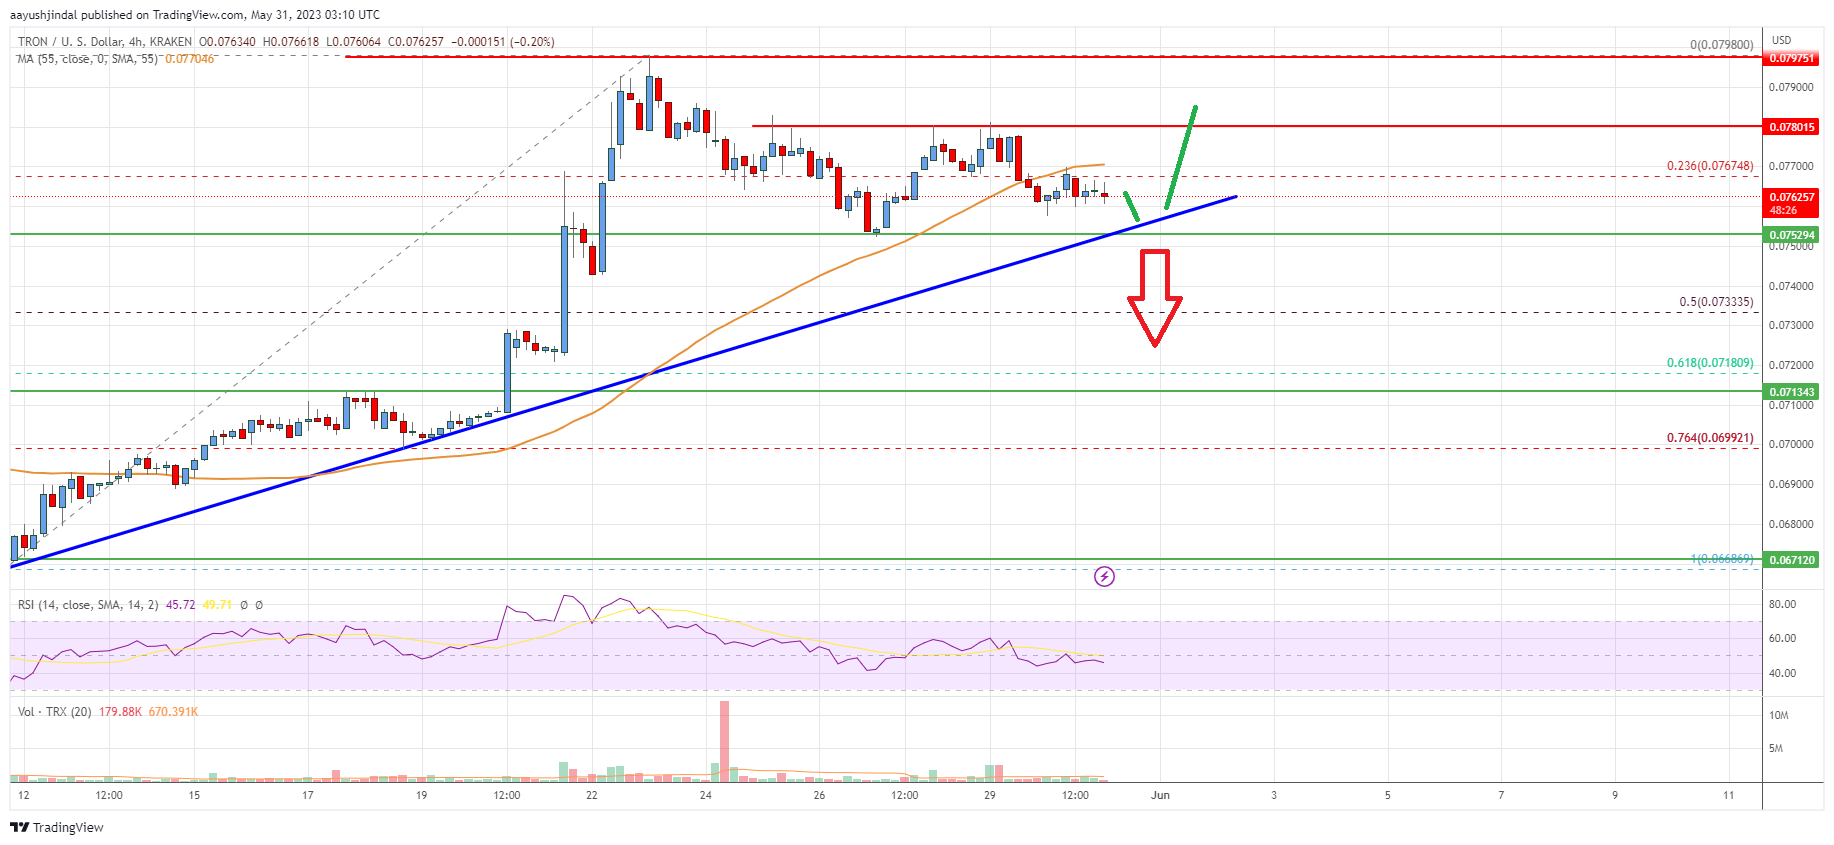
The chart indicates that TRX’s price is now trading below $0.0780 and the 55 simple moving average (4 hours). Overall, the price could continue to move up if it breaks the $0.0780 resistance zone.
Technical Indicators
4 hours MACD – The MACD for TRX/USD is now gaining momentum in the bearish zone.
4 hours RSI – The RSI for TRX/USD is below the 50 level.
Key Support Levels – $0.0752 and $0.0718.
Key Resistance Levels – $0.0780, $0.080, and $0.0825.


Leave a Reply
You must be logged in to post a comment.