
- Bitcoin price is declining and trading below the $9,000 level against the US Dollar.
- It is currently showing bearish signs and it could slide further towards the $8,410 support.
- There is a major contracting triangle forming with resistance near $8,900 on the 4-hours chart of the BTC/USD pair (data feed from Coinbase).
- The pair could dive towards the $8,400 and $8,300 levels before it starts a decent increase.
Bitcoin price is currently trading in a bearish zone below $9,000 against the US Dollar. BTC remains at a risk of more losses towards $8,400 before it starts a fresh upward move.
Bitcoin Price Analysis
In the past few days, bitcoin price remained in a bearish zone below the $9,500 level against the US Dollar. BTC broke the main $9,200 support zone to move into a bearish zone.
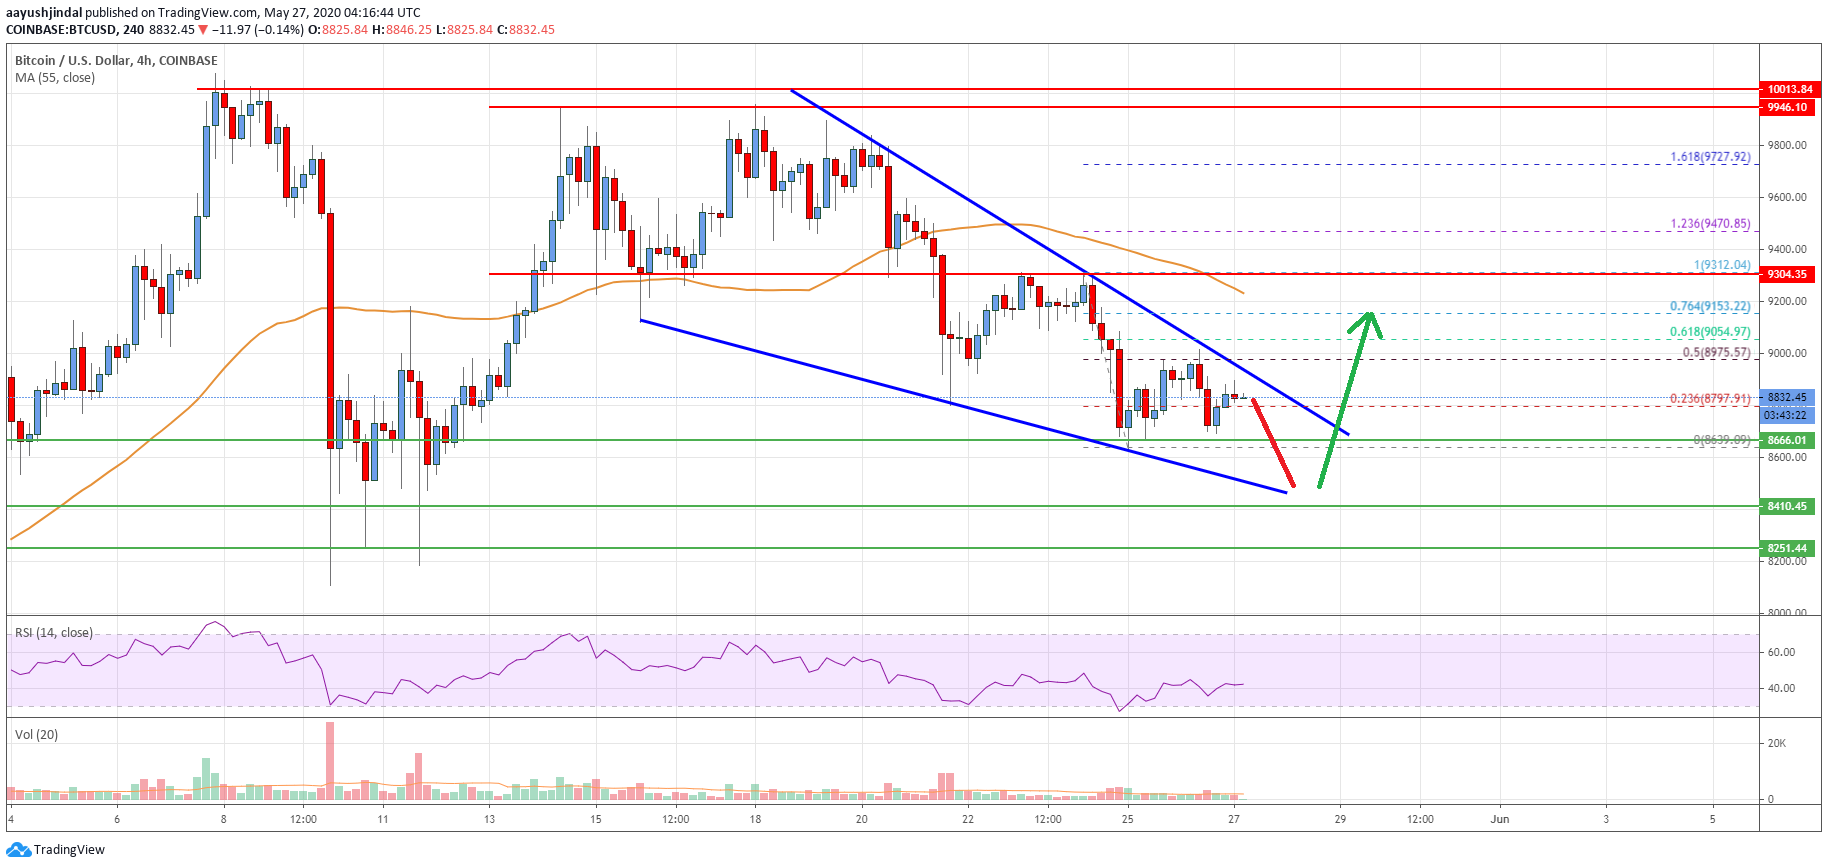
The recent decline was such that the price even settled below the $9,000 level and the 55 simple moving average (4-hours). A new weekly low is formed near $8,639 and the price is currently consolidating losses.
It is trading above the $8,800 short term resistance. Besides, there was a break above the 23.6% Fib retracement level of the recent decline from the $9,312 high to $8,639 low. On the upside, the price seems to be facing hurdles near the $8,900 and $8,950 levels.
There is also a major contracting triangle forming with resistance near $8,900 on the 4-hours chart of the BTC/USD pair. The 50% Fib retracement level of the recent decline from the $9,312 high to $8,639 low is also near the $8,975 level to stop the upward move.
If bitcoin price manages to clear the triangle resistance and $9,000, it could correct higher towards the $9,200 resistance. The main resistance is near the $9,300 level and the 55 simple moving average (4-hours).
To move into a new uptrend and start a fresh increase, the price must break the $9,300 resistance and the 55 simple moving average (4-hours).
Conversely, the price may perhaps dive further below the $8,800 and $8,600 levels. The main support is near the $8,400 area, where the bulls are likely to take a stand. Any further losses could lead the price towards $8,250.
Looking at the chart, bitcoin price is clearly trading in a bearish zone below the $9,000 level. It seems like the price could dive towards the $8,400 and $8,300 levels before it starts a decent increase.
Technical indicators
4 hours MACD – The MACD is slowly losing pace in the bearish zone.
4 hours RSI (Relative Strength Index) – The RSI is currently just above the 40 level.
Key Support Levels – $8,800 and $8,400.
Key Resistance Levels – $8,900, $9,000 and $9,300.


Leave a Reply
You must be logged in to post a comment.