
- Bitcoin price started a strong decline below the $40,000 support against the US Dollar.
- The price is now trading well below $45,000 and the 55 simple moving average (4-hours).
- There is a crucial bearish trend line forming with resistance near $40,500 on the 4-hours chart of the BTC/USD pair (data feed from Coinbase).
- The pair is likely to start a strong recovery if it settles above $42,000 in the near term.
Bitcoin price is attempting an upside correction from $30,000 against the US Dollar. BTC must surpass $40,000 and $42,000 to start a strong upward move.
Bitcoin Price Analysis
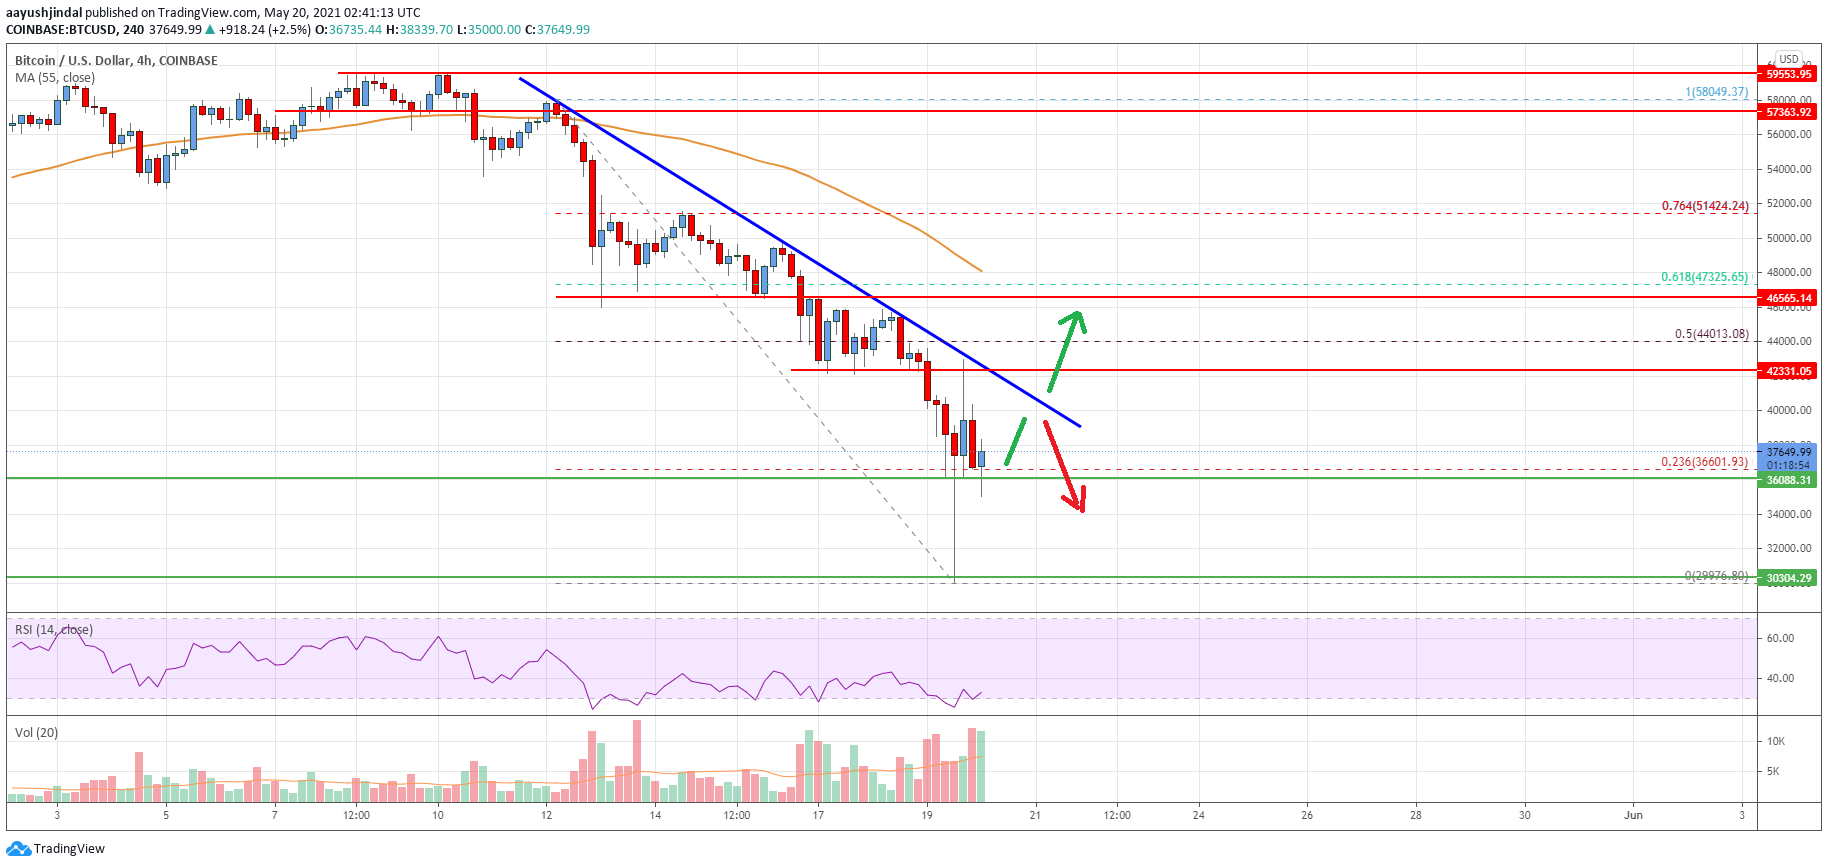
Bitcoin price failed to stay above the main $50,000 support zone. As a result, there was a major decline below the $45,000 support and the 55 simple moving average (4-hours).
The price even broke the $40,000 support zone. The decline gained pace below the $36,000 level. It even tested the $30,000 support zone. A low is formed near $29,976 and the price is now correcting higher. It recovered above the $32,000 and $35,000 levels.
There was a break above the 23.6% Fib retracement level of the recent decline from the $58,050 swing high to $29,976 low. The price is now trading above $36,000 but it is still well below the 55 simple moving average (4-hours).
There is also a crucial bearish trend line forming with resistance near $40,500 on the 4-hours chart of the BTC/USD pair. The next major resistance is near the $42,000 level, followed by the 50% Fib retracement level of the recent decline from the $58,050 swing high to $29,976 low.
A successful break above the trend line and $42,000 could stage a strong recovery in the coming sessions. On the downside, the $35,000 level is a decent support. The main breakdown support is near the $30,000 level, below which the price might drop another 15%-20% in the coming days.
Looking at the chart, bitcoin price is clearly t trading well below $45,000 and the 55 simple moving average (4-hours). Overall, the price is likely to start a strong recovery if it settles above $42,000 in the near term.
Technical indicators
4 hours MACD – The MACD is slowly gaining momentum in the bullish zone.
4 hours RSI (Relative Strength Index) – The RSI is now well below the 50 level.
Key Support Levels – $35,000 and $30,000.
Key Resistance Levels – $40,000, $42,000 and $46,500.


Leave a Reply
You must be logged in to post a comment.