
- Bitcoin price started a fresh decline from the $60,000 resistance against the US Dollar.
- The price is now trading above $57,000 and the 55 simple moving average (4-hours).
- There is a major bearish trend line with resistance near $57,850 on the 4-hours chart of the BTC/USD pair (data feed from Coinbase).
- The pair could accelerate higher if there is a clear break above $58,500 and $59,000.
Bitcoin price is struggling below $60,000 against the US Dollar. BTC might decline heavily if there is no clear break above the $60,000 resistance zone.
Bitcoin Price Analysis
Bitcoin price failed to start a steady increase above the $60,000 resistance zone. As a result, there was a fresh bearish reaction and BTC declined below the $58,000 support zone.
The price traded below the $57,000 support level and the 55 simple moving average (4-hours). A low was formed near $53,327 and recently there was an upside correction. There was a break above the $55,000 and $57,000 resistance levels.
It is now trading above $57,000 and the 55 simple moving average (4-hours). On the upside, an initial resistance is near the $57,850 level.
There is also a major bearish trend line with resistance near $57,850 on the 4-hours chart of the BTC/USD pair. The main resistance is forming near the $58,500 zone. A close above the $58,500 zone is needed for a fresh increase. In the stated case, the price is likely to rise steadily and might even surpass the $60,000 level.
An immediate support on the downside is near the $56,250 level. It is near the 50% Fib retracement level of the upward move from the $53,327 swing low to $59,249 high.
The next key support is near the $55,600 level. It is near the 61.8% Fib retracement level of the upward move from the $53,327 swing low to $59,249 high. If the price fails to stay above $55,600, it could extend losses in the near term. The next major support sits near $54,000, below which there is a risk of a move towards the $52,000 level.
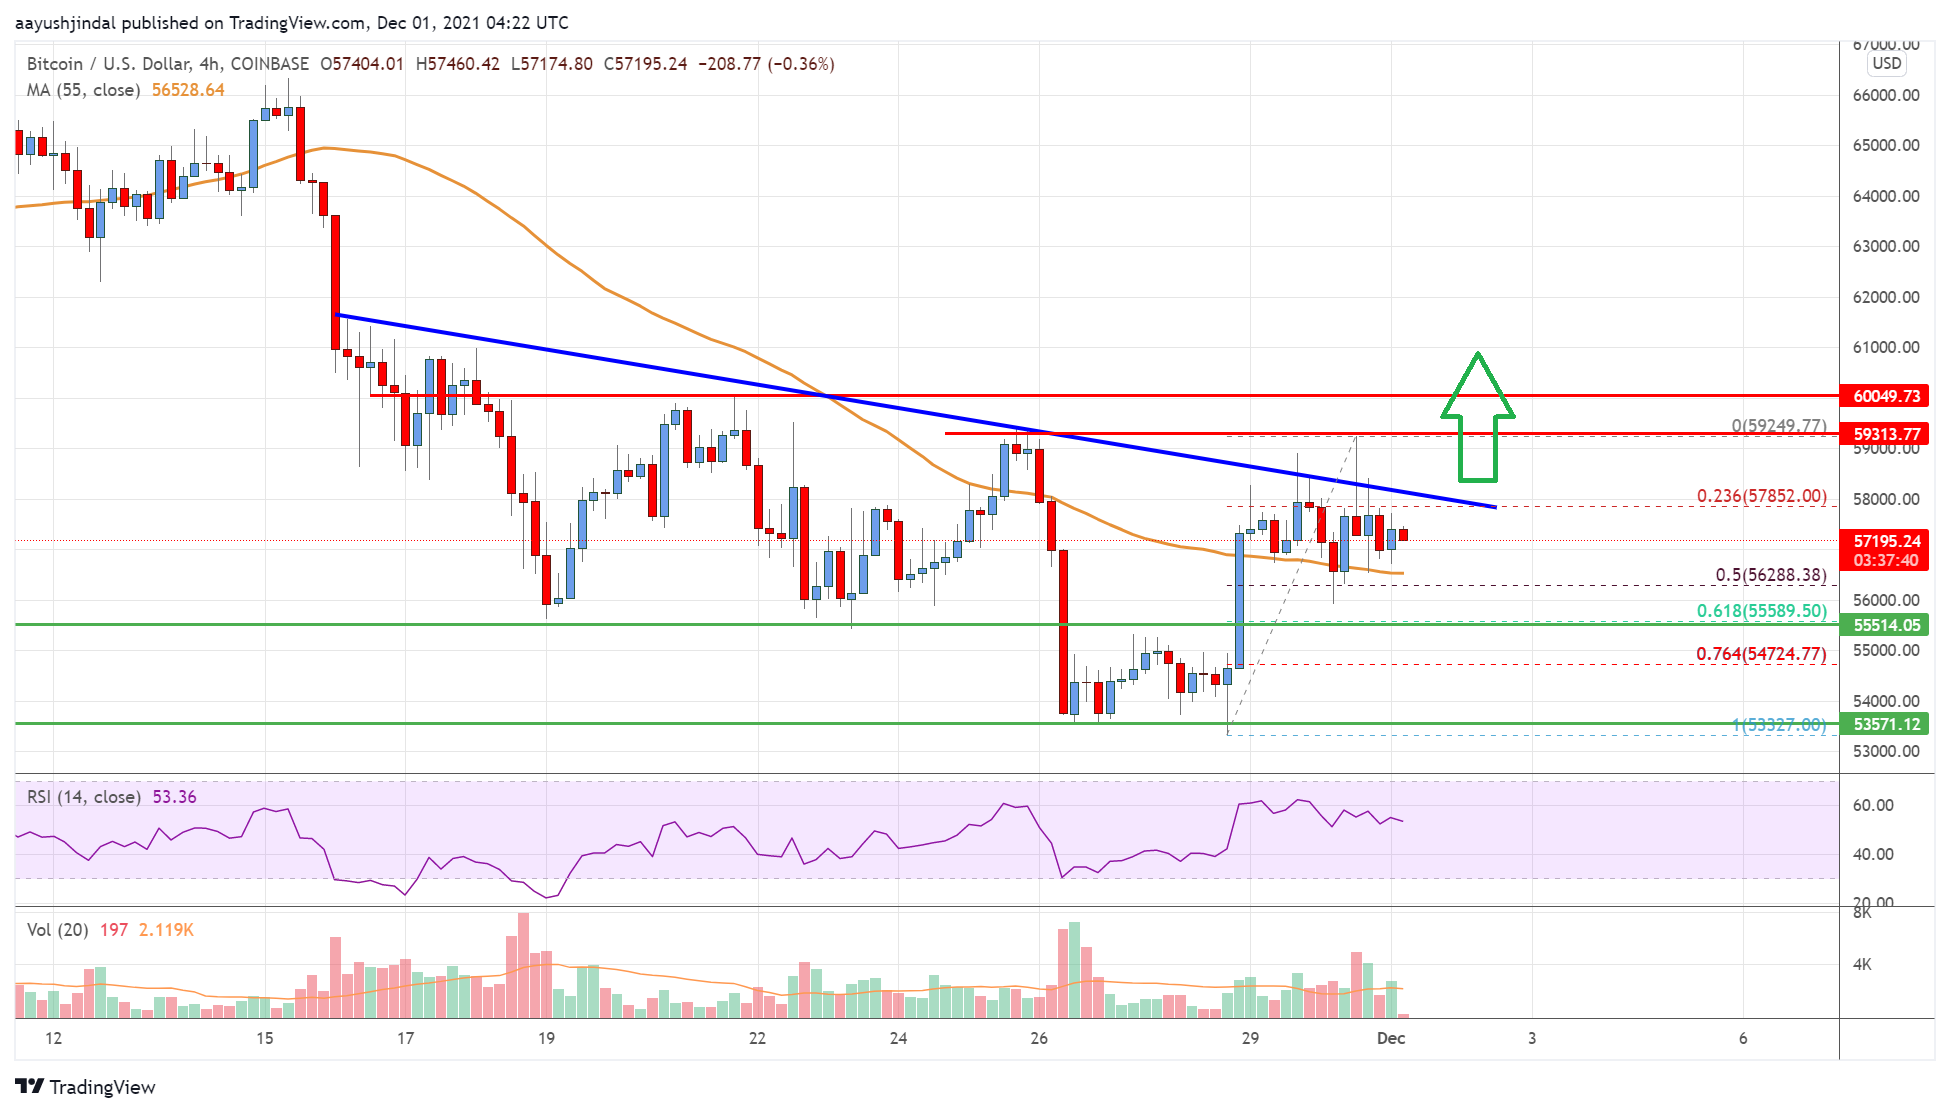
Looking at the chart, bitcoin price is clearly trading above $57,000 and the 55 simple moving average (4-hours). Overall, the price could accelerate higher if there is a clear break above $58,500 and $59,000.
Technical indicators
4 hours MACD – The MACD is now losing momentum in the bearish zone.
4 hours RSI (Relative Strength Index) – The RSI is just above the 50 level.
Key Support Levels – $55,600 and $52,000.
Key Resistance Levels – $57,850, $58,500 and $60,000.


Leave a Reply
You must be logged in to post a comment.