- Bitcoin price started a fresh decline from the $66,000 resistance against the US Dollar.
- The price is now trading below $62,000 and the 55 simple moving average (4-hours).
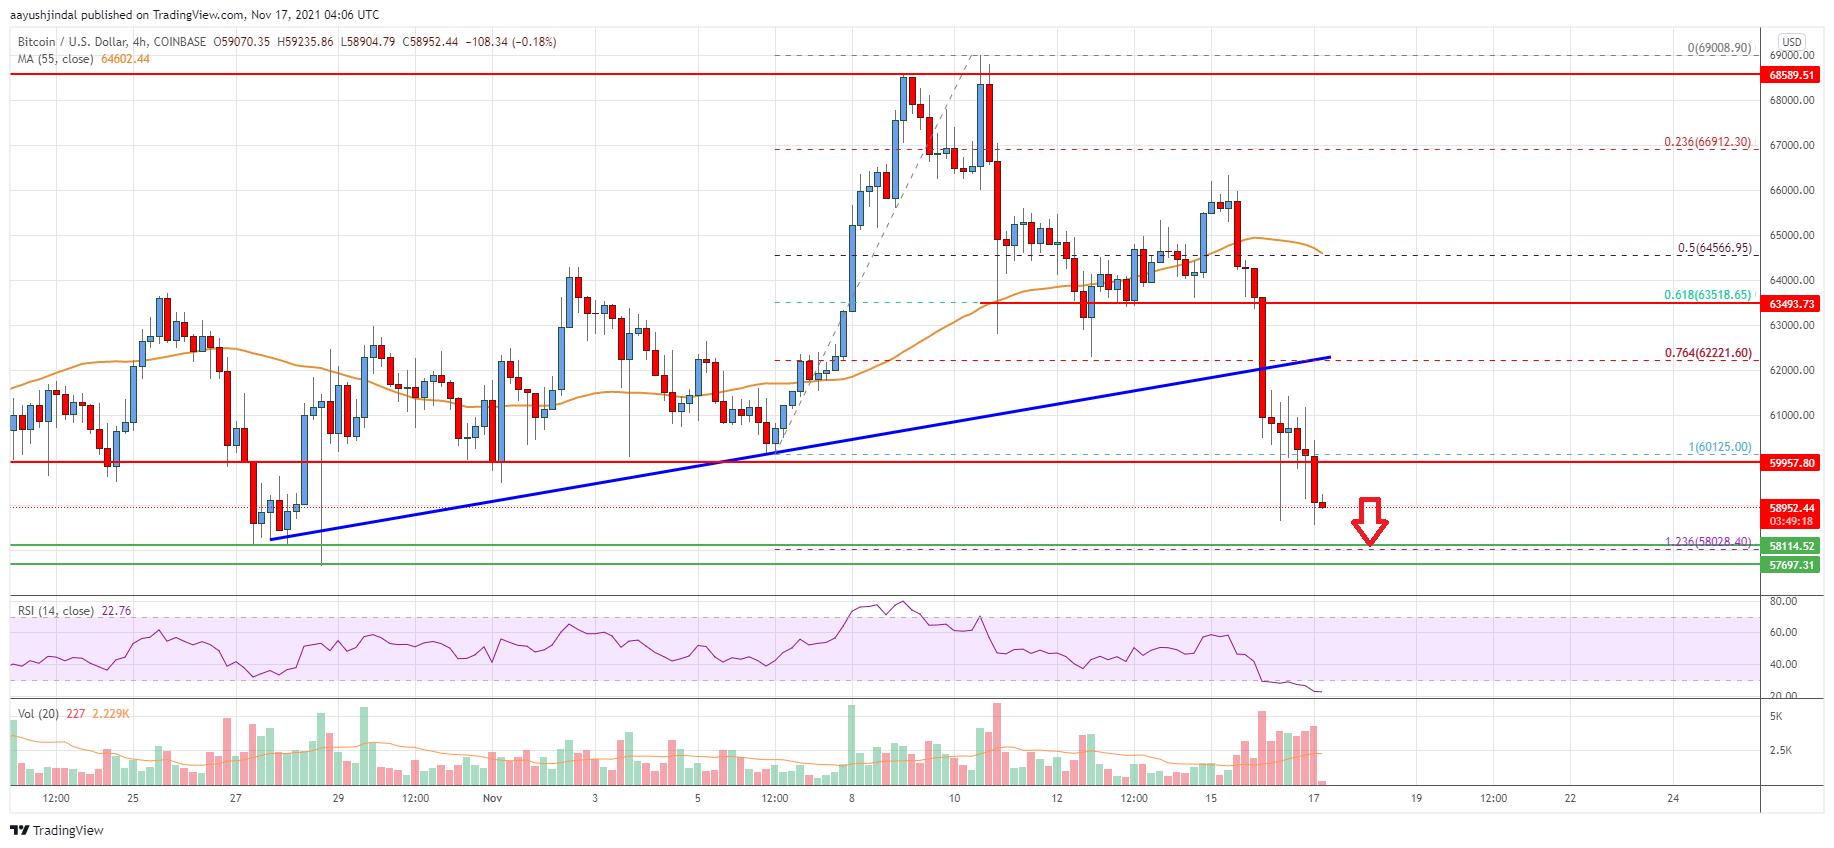
- There was a break below a key bullish trend line with support near $62,200 on the 4-hours chart of the BTC/USD pair (data feed from Coinbase).
- The pair could accelerate lower if there is a break below the $58,500 support zone.
Bitcoin price is gaining pace below $60,000 against the US Dollar. BTC might decline heavily if there is a clear break below the $58,500 support zone.
Bitcoin Price Analysis
Bitcoin price gained pace above the $65,000 resistance zone. However, BTC failed to gain momentum above the $66,000 level. As a result, there was a fresh bearish reaction below the $65,000 support zone.
The price traded below the $63,200 support level and the 55 simple moving average (4-hours). Besides, there was a break below a key bullish trend line with support near $62,200 on the 4-hours chart of the BTC/USD pair.
There was a move below the 76.4% Fib retracement level of the upward move from the $60,125 swing low to $69,008 high. The pair even broke the $62,000 support level and spiked below $60,000. It is now trading well below 62,000 and the 55 simple moving average (4-hours).
An immediate support on the downside is near the $58,200 level. The next key support is near the $58,000 level. It is near the 1.236 Fib extension level of the upward move from the $60,125 swing low to $69,008 high.
If the price fails to stay above $58,000, it could extend losses in the near term. The next major support sits near $57,200, below which there is a risk of a move towards the $55,000 level.
On the upside, an initial resistance is near the $60,000 level. The main resistance is forming near the $62,000 zone. A close above the $62,000 zone is needed for a fresh increase. In the stated case, the price is likely to rise steadily towards the $65,000 level.

Looking at the chart, bitcoin price is clearly trading below $62,000 and the 55 simple moving average (4-hours). Overall, the price could accelerate lower if there is a break below the $58,500 support zone.
Technical indicators
4 hours MACD – The MACD is now gaining momentum in the bearish zone.
4 hours RSI (Relative Strength Index) – The RSI is well below the 40 level.
Key Support Levels – $58,000 and $55,000.
Key Resistance Levels – $60,000, $61,200 and $62,000.


Leave a Reply
You must be logged in to post a comment.