- Bitcoin price started a fresh increase above the $65,000 zone against the US Dollar.
- The price is now trading above $65,000 and the 55 simple moving average (4-hours).
- There was a break above a major contracting triangle with resistance near $61,800 on the 4-hours chart of the BTC/USD pair (data feed from Coinbase).
- The pair could correct lower towards the $64,000 support zone in the near term.
Bitcoin price traded to a new all-time high near $68,560 against the US Dollar. BTC could revisit the $64,000 support zone in the near term.
Bitcoin Price Analysis
Bitcoin price remained in a positive zone above the $62,000 level. As a result, BTC started a fresh increase above the $64,000 and $65,000 resistance levels.
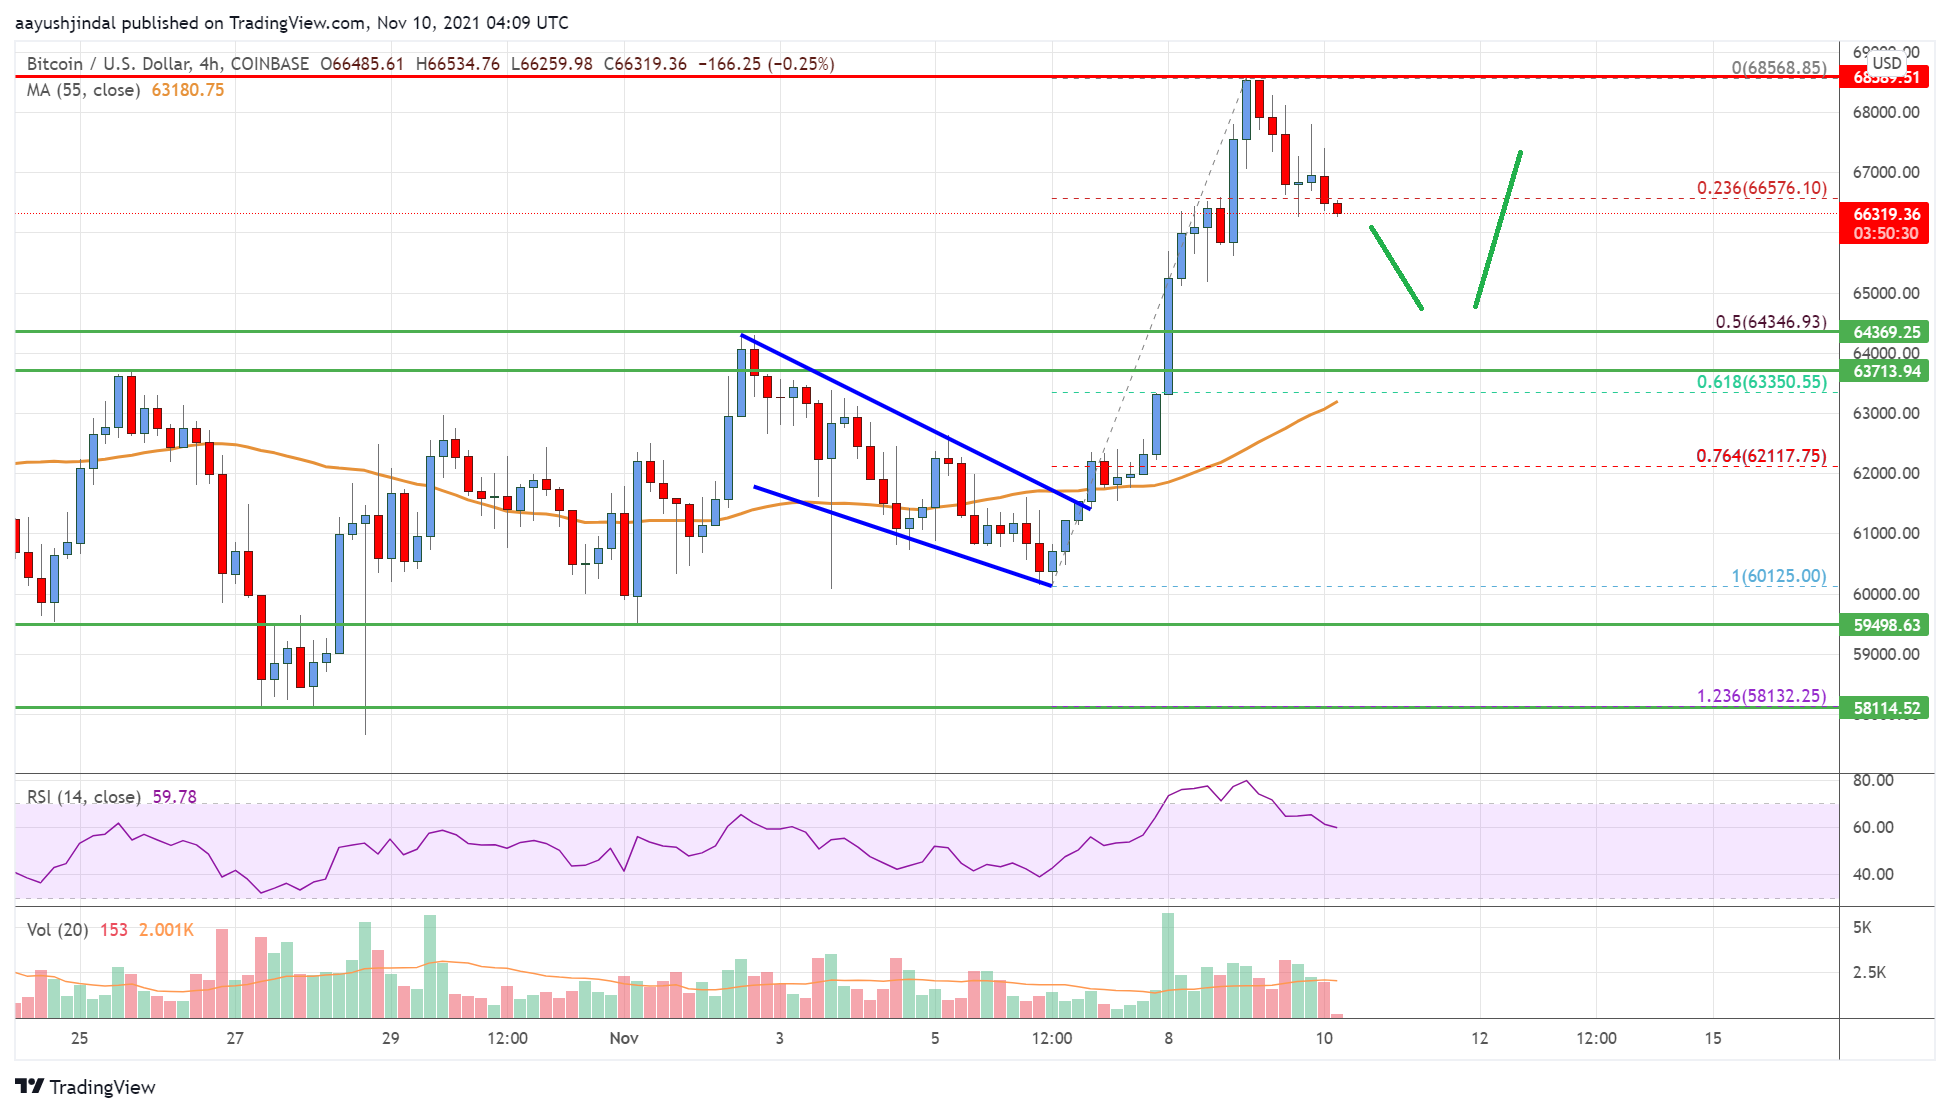
There was a break above a major contracting triangle with resistance near $61,800 on the 4-hours chart of the BTC/USD pair. The pair gained pace for a move above the $66,500 level and the 55 simple moving average (4-hours).
The pair traded to a new all-time at $68,568 before it started a minor decline. The pair traded below the $68,000 and $67,000 support levels. It even declined below the 23.6% Fib retracement level of the upward move from the $60,125 swing low to $68,568 high.
On the downside, an initial support is near the $66,000 level. The next key support is forming near the $65,000 level, below which the price could decline towards the $64,000 level or the 55 SMA.
The 50% Fib retracement level of the upward move from the $60,125 swing low to $68,568 high is also near the $64,000 zone to act as a support.
On the upside, an initial resistance is near the $67,200 level. The main resistance is forming near the $68,000 zone. A close above the $68,000 zone is needed for a fresh increase. In the stated case, the price is likely to rise steadily towards the $68,500 level.

Looking at the chart, bitcoin price is clearly trading above $65,000 and the 55 simple moving average (4-hours). Overall, the price could correct lower towards the $64,000 support zone in the near term.
Technical indicators
4 hours MACD – The MACD is now losing momentum in the bullish zone.
4 hours RSI (Relative Strength Index) – The RSI is now above the 50 level.
Key Support Levels – $65,000 and $64,000.
Key Resistance Levels – $67,500, $68,000 and $68,500.


Leave a Reply
You must be logged in to post a comment.