- Bitcoin price started a major decline below the $45,000 support against the US Dollar.
- The price is now trading below $44,000 and the 55 simple moving average (4-hours).
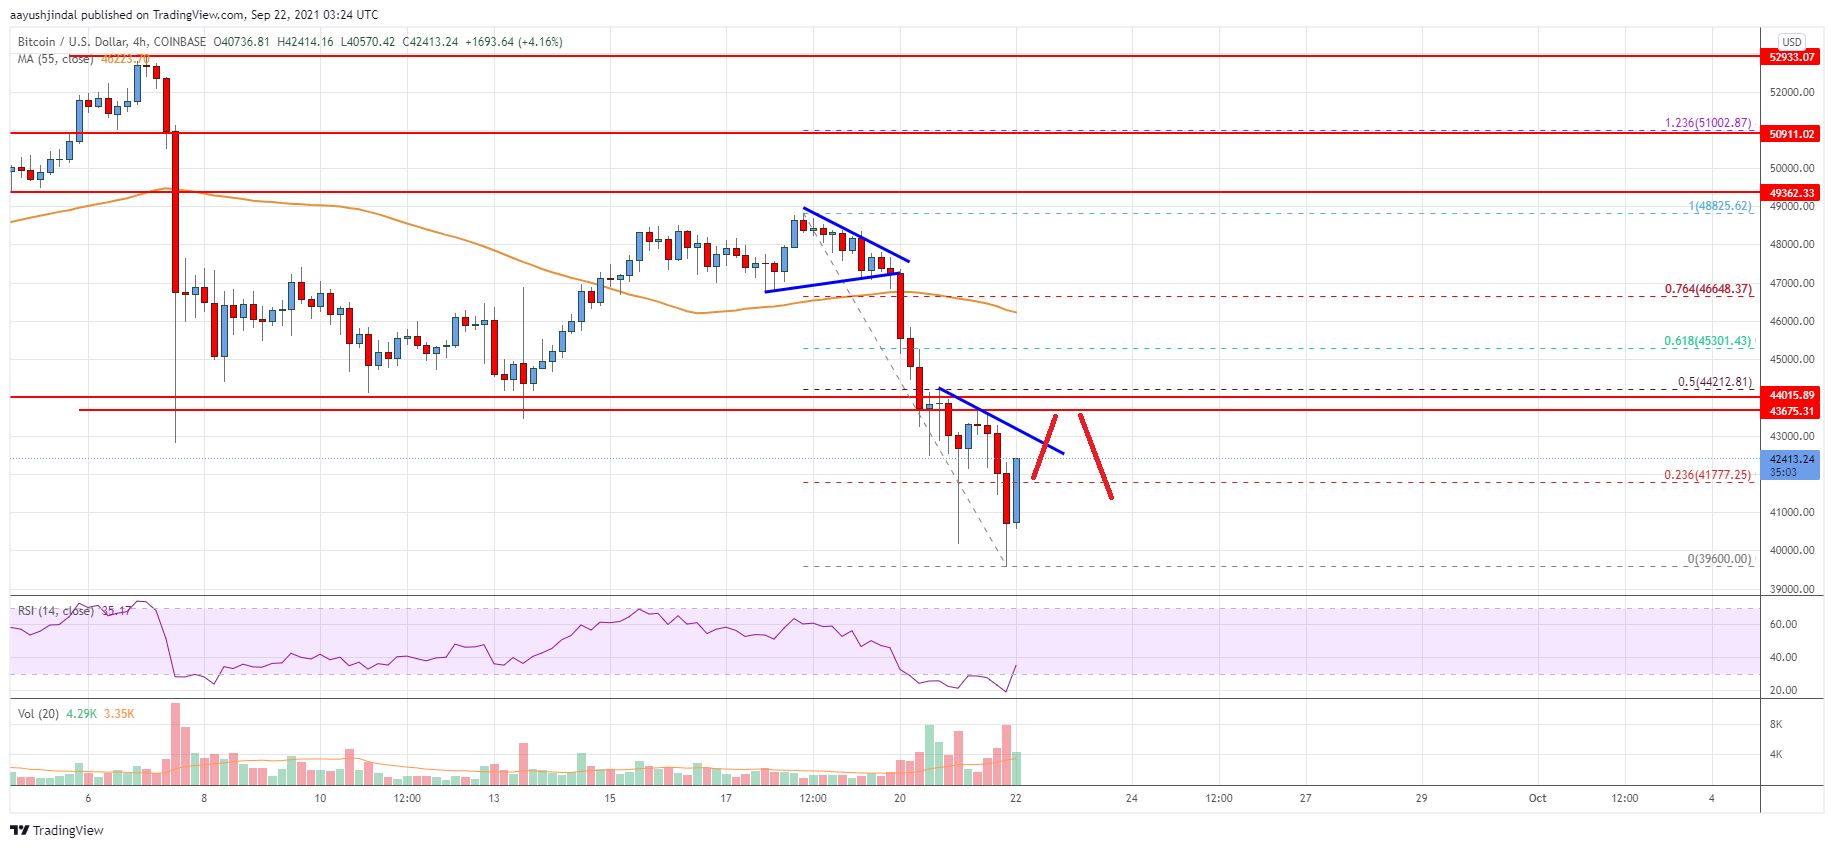
- There is a key bearish trend line forming with resistance near $42,850 on the 4-hours chart of the BTC/USD pair (data feed from Coinbase).
- The pair must settle above $44,000 to start a steady increase in the near term.
Bitcoin price is recovering higher above $42,000 against the US Dollar. BTC could extend gains if there is a clear break above the $44,000 level.
Bitcoin Price Analysis
Bitcoin price started a major decline from well above the $47,000 zone. BTC broke the $45,000 and $44,000 support levels to enter a bearish zone.
The price even spiked below $40,000 and settled below the 55 simple moving average (4-hours). It traded as low as $39,600 and recently started an upside correction. There was a break above the $40,000 and $40,500 levels.
The price climbed above the 23.6% Fib retracement level of the recent decline from the $48,825 swing high to $39,600 low. On the upside, an initial resistance is near the $42,500 level. The first major resistance is near the $43,000 level.
There is also a key bearish trend line forming with resistance near $42,850 on the 4-hours chart of the BTC/USD pair. The main resistance is forming near the $44,000 zone or the 50% Fib retracement level of the recent decline from the $48,825 swing high to $39,600 low.
A close above the $44,000 zone is needed for a fresh increase. In the stated case, the price is likely to rise steadily towards the $47,000 level.
An immediate support on the downside is near the $41,200 level. The first key support is near the $40,000 level. If the price fails to stay above $40,000, it could revisit the $39,600 support zone. Any more losses could open the doors for a move towards the $38,000 support zone.

Looking at the chart, bitcoin price is clearly trading below $44,000 and the 55 simple moving average (4-hours). Overall, the price must settle above $44,000 to start a steady increase in the near term.
Technical indicators
4 hours MACD – The MACD is now gaining momentum in the bullish zone.
4 hours RSI (Relative Strength Index) – The RSI is now well below the 50 level.
Key Support Levels – $41,200 and $40,000.
Key Resistance Levels – $42,500, $43,000 and $44,000.


Leave a Reply
You must be logged in to post a comment.