
- Tron price started a fresh decline from the $0.1200 resistance against the US Dollar.
- TRX price is now trading below $0.1000 and the 55 simple moving average (4-hours).
- There was a break below a major bullish trend line with support near $0.1150 on the 4-hours chart (data feed via Bitfinex).
- The pair could accelerate lower if there is a clear break below the $0.8200 support zone.
TRON price failed to continue higher above $0.1200 against the US Dollar, similar to bitcoin. TRX price is trading below $0.1000 and it remains at a risk of more losses.
Tron Price Analysis
After forming a top near the $0.1200 level, tron price started a fresh decline against the US Dollar. TRX price broke the $0.1150 support zone to move into a bearish zone.
The price even broke the $0.1000 support and settled below the 55 simple moving average (4-hours). There was also a break below a major bullish trend line with support near $0.1150 on the 4-hours chart. Finally, the price spiked below $0.0900 and traded as low as $0.0867.
It is now consolidating losses above the $0.0850 support. An initial resistance is near the $0.0920 level. It is near the 23.6% Fib retracement level of the recent decline from the $0.1204 swing high to $0.0867 low.
The first major resistance is near the $0.0.965 level, above which the price could rise towards the $0.1000 level. The next major stop for the bulls could be $0.1035 in the near term. It is near the 50% Fib retracement level of the recent decline from the $0.1204 swing high to $0.0867 low.
A close above $0.1035 and $0.1050 is must for a fresh increase. On the downside, an initial support is near the $0.0865 level. The first major support is now forming near $0.0825. Any more losses might call for a sharp decline towards the $0.0765 level. The next major support below $0.0765 could be near the $0.0650 zone.
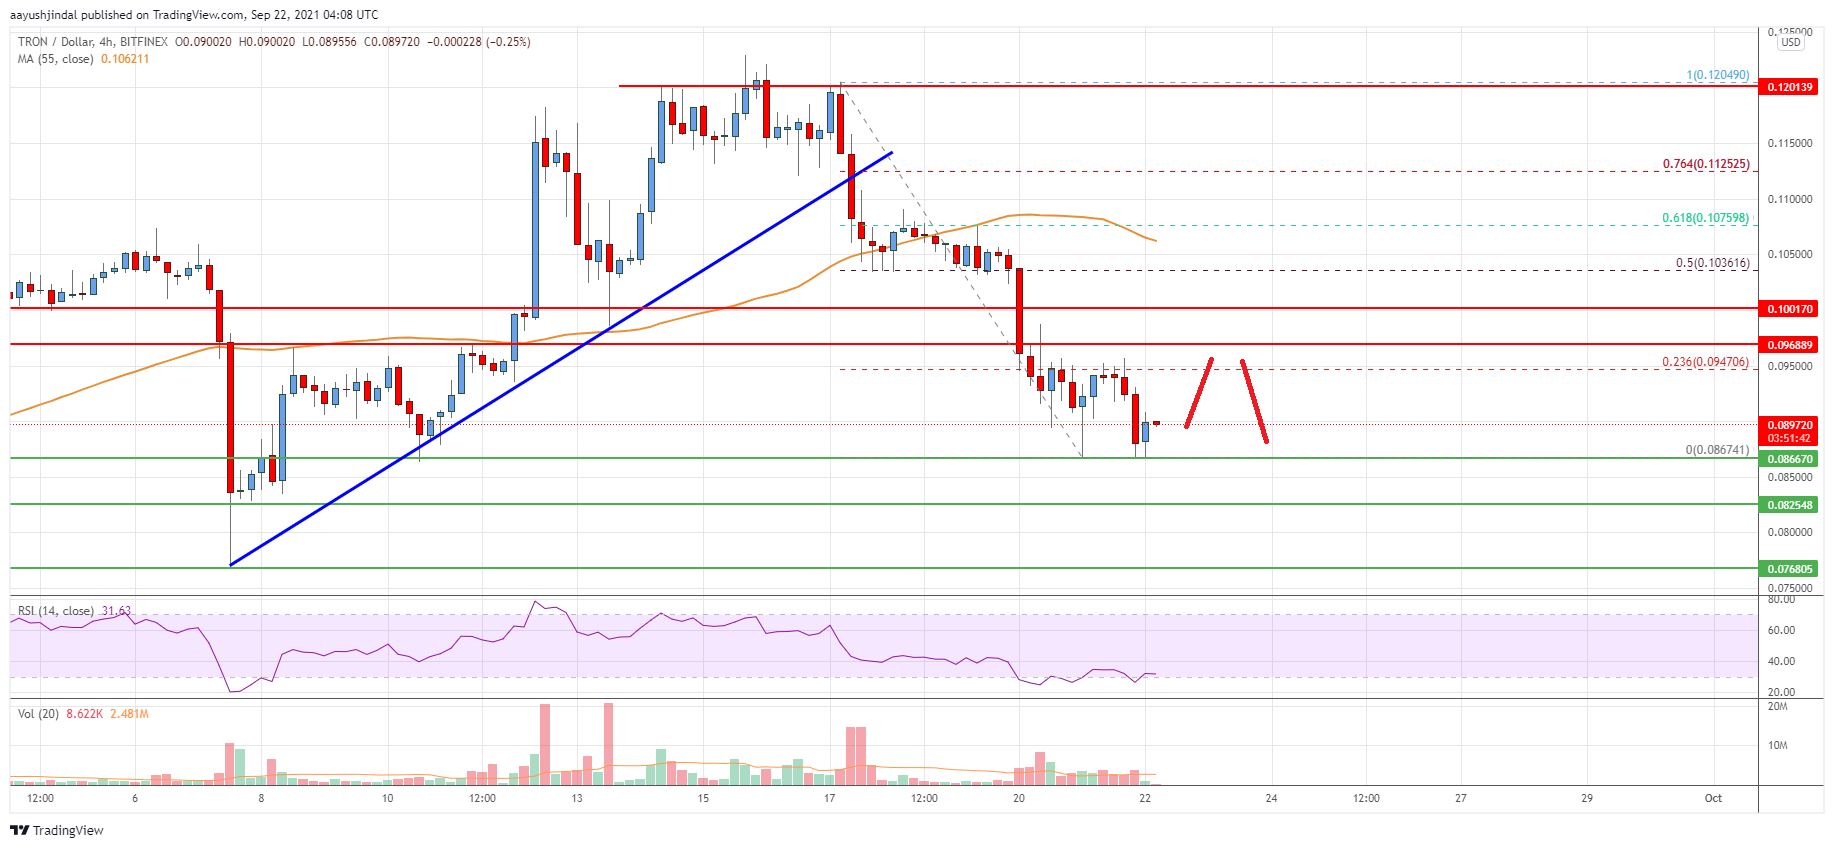
The chart indicates that TRX price is now trading below $0.1000 and the 55 simple moving average (4-hours). Overall, the price could accelerate lower if there is a clear break below the $0.8200 support zone.
Technical Indicators
4 hours MACD – The MACD for TRX/USD is slowly losing momentum in the bearish zone.
4 hours RSI – The RSI for TRX/USD is now well below the 50 level.
Key Support Levels – $0.0865 and $0.0825.
Key Resistance Levels – $0.0965, $0.1000 and $0.1035.


Leave a Reply
You must be logged in to post a comment.