- Bitcoin price is consolidating above the $8,000 and $7,800 support levels against the US Dollar.
- The price is facing a strong resistance on the upside near the $8,350 and $8,400 levels.
- There are two key bearish trend lines in place with resistance near $8,350 on the 4-hours chart of the BTC/USD pair (data feed from Coinbase).
- The pair could either rally above the $8,350 resistance or it might decline further below $7,800.
Bitcoin price is facing a strong resistance near $8,350 and $8,400 against the US Dollar. BTC must surpass $8,400 and gain strength above $8,500 for a fresh increase.
Bitcoin Price Analysis
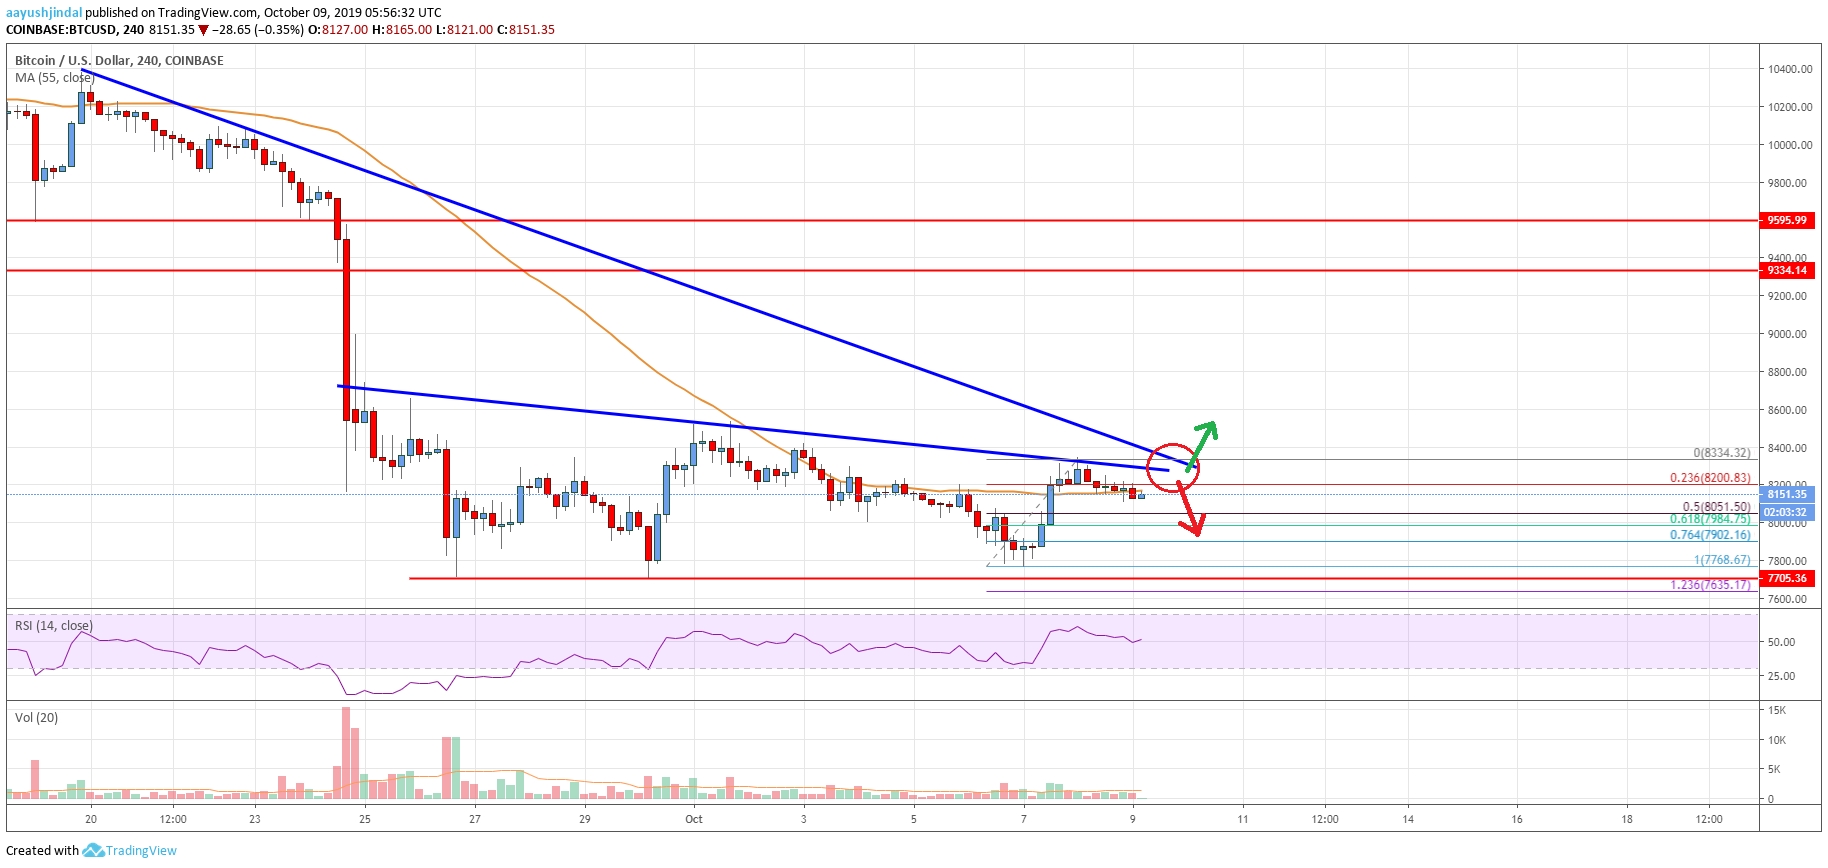
In the past few days, bitcoin price traded in a broad range below the $8,500 resistance against the US Dollar. Moreover, the BTC/USD pair remained well below $8,500 and the 55 simple moving average (4-hours). The last swing low was formed near the $7,768 level before the price recovered higher. It broke the $8,000 and $8,150 resistance levels. Moreover, there was a break above $8,300 and the 55 simple moving average (4-hours).
However, the price failed to gain strength above $8,325 and topped near the $8,334 level. It is currently correcting lower and is trading near the $8,140 level. An immediate support on the downside is near the $8,050 level. It coincides with the 50% Fib retracement level of the recent rise from the $7,768 low to $8,334 high. The main support on the downside is near the $7,980 level.
Moreover, the 61.8% Fib retracement level of the recent rise from the $7,768 low to $8,334 high is near the $7,980 level to provide support. If there is a downside break below the $7,980 support, bitcoin price could revisit the $7,775 zone. Any further losses might call for a sharp decline below the $7,700 area. On the upside, there are many hurdles forming near the $8,350 and $8,400 levels.
More importantly, there are two key bearish trend lines in place with resistance near $8,350 on the 4-hours chart of the BTC/USD pair. Therefore, a clear break above both trend lines and $8,400 is must for a decent recovery above the $8,500 level. The next key resistance above $8,500 is near the $9,000 level.

Looking at the chart, bitcoin price is facing a couple of important hurdles near the $8,350 and $8,400 levels. Therefore, the price could either rally above the $8,350 resistance or it might decline further below $7,800.
Technical indicators
4 hour MACD – The MACD is losing momentum in the bullish zone.
4 hour RSI (Relative Strength Index) – The RSI is currently near the 50 level, with a bearish angle.
Key Support Levels – $8,000 and $7,700.
Key Resistance Levels – $8,350, $8,400 and $8,500.


Leave a Reply
You must be logged in to post a comment.