
- ADA price is currently correcting higher from the $0.0379 swing low against the US Dollar.
- The price is trading above the $0.0400 support area and it could continue to rise above $0.0450.
- There was a break above a major bearish trend line with resistance near $0.0390 on the 4-hours chart (data feed via Kraken).
- The price is likely to continue higher above $0.0435 as long as it is above the $0.0380 support area.
Cardano price is slowly rebounding higher against the US Dollar and bitcoin. ADA price must break $0.0435 and $0.0450 to continue higher in the near term.
Cardano Price Analysis
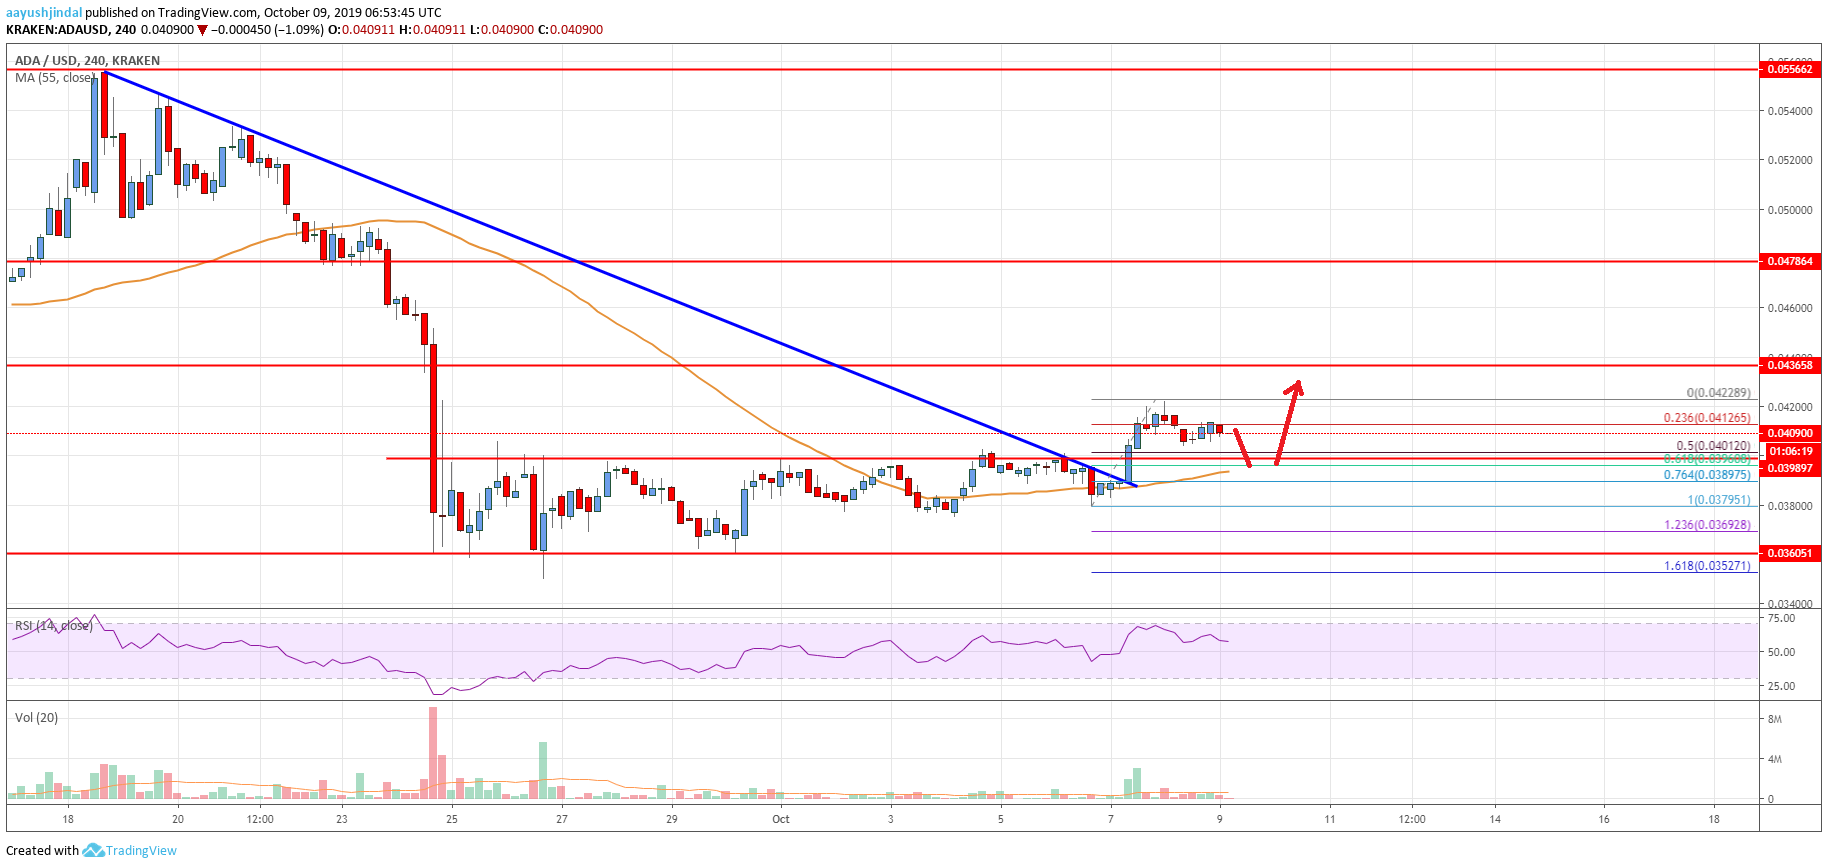
In the past few days, cardano price consolidated above the $0.0365 support area against the US Dollar. The ADA/USD pair slowly moved higher and broke the $0.0380 resistance area. Moreover, there was a break above the $0.0400 resistance and the 55 simple moving average (4-hours). It opened the doors for more upsides above the $0.0405 resistance area.
During the rise, there was a break above a major bearish trend line with resistance near $0.0390 on the 4-hours chart. Finally, the price broke $0.0420 and recently traded as high as $0.0422. It is currently correcting lower and is trading near the $0.0410 level. An immediate support is near the $0.0400 level and the 50% Fibonacci retracement level of the recent rise from the $0.0379 low to $0.0422 high.
The main support on the downside is near the $0.0390 level and the 55 simple moving average (4-hours). Besides, the 61.8% Fibonacci retracement level of the recent rise from the $0.0379 low to $0.0422 high is likely to act as a strong support. Only a successful break below the $0.0380 support area could push the price back towards the $0.0365 support area.
On the upside, there are a few key hurdles forming near the $0.0425 and $0.0435 levels. A successful break above the $0.0435 resistance area could set the pace for more gains above the $0.0450 resistance area. The next key resistance is near the $0.0475 level, followed by the $0.0500 barrier.
The chart indicates that ADA price is slowly moving higher and is trading nicely above $0.0400 and $0.0390. Having said that, a clear break above the $0.0425 and $0.0435 resistance levels is must for an upside acceleration. If not, there is a risk of another drop below the $0.0400 and $0.0380 support levels.
Technical Indicators
4 hours MACD – The MACD for ADA/USD is losing momentum in the bullish zone.
4 hours RSI – The RSI for ADA/USD is currently correcting lower and is approaching the 50 level.
Key Support Levels – $0.0400 and $0.0380.
Key Resistance Levels – $0.0425 and $0.0435.


Leave a Reply
You must be logged in to post a comment.