- Bitcoin price is showing a lot of positive signs above the $9,000 level against the US Dollar.
- The price surged recently and traded to a near yearly high at $9,437.
- There was a break above a short term bullish flag with resistance near $9,070 on the 4-hours chart of the BTC/USD pair (data feed from Coinbase).
- The pair could correct a few points, but it remains supported near $9,160 and $9,000.
Bitcoin price is up more than 10% in the past few days against the US Dollar. BTC settled above $9,000 and it is likely to continue higher in the coming days.
Bitcoin Price Analysis
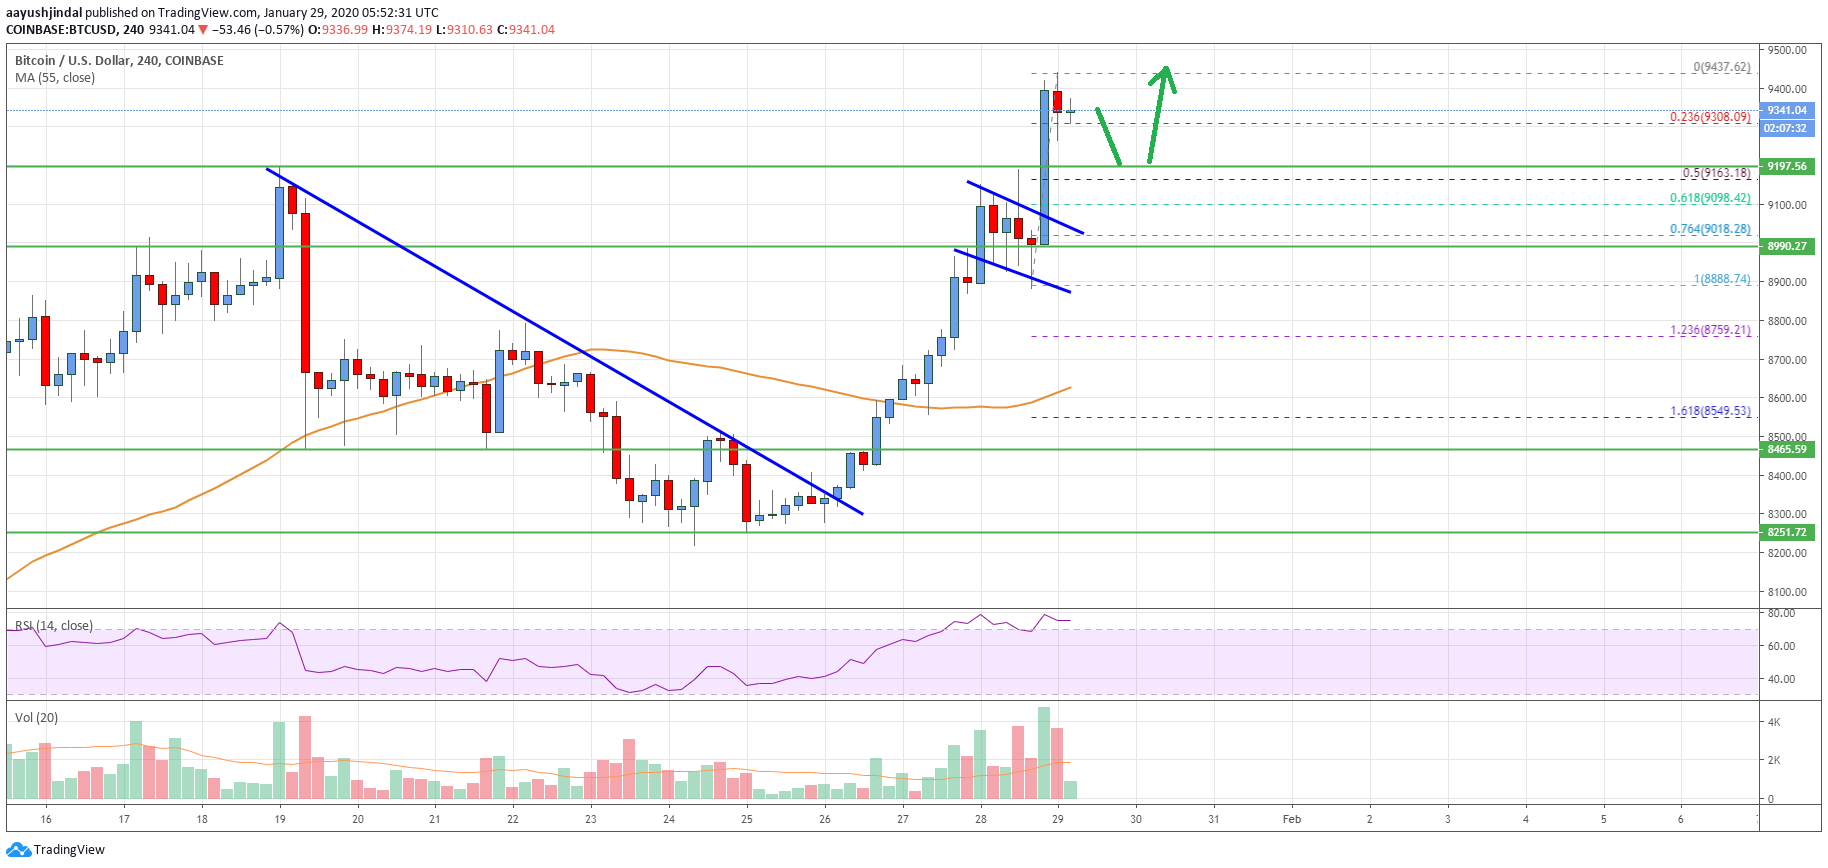
In the past few days, bitcoin price gained bullish momentum above the $8,500 and $8,800 resistance levels against the US Dollar. BTC even settled above the $9,000 level and the 55 simple moving average (4-hours).
During the rise, there was a break above a short term bullish flag with resistance near $9,070 on the 4-hours chart of the BTC/USD pair. The price broke the $9,200 level and traded to a new yearly high at $9,437.
It is currently consolidating gains and trading near the $9,300 support. Besides, the 23.6% Fib retracement level of the recent wave from the $8,888 low to $9,437 high is near the $9,308 level.
If bitcoin price slides below the $9,300 support, it could correct lower towards the $9,160 support level. It coincides with the 50% Fib retracement level of the recent wave from the $8,888 low to $9,437 high.
Any further losses may perhaps lead the price towards the $9,000 pivot level. The stated $9,000 level holds the key, below which there is a risk of a larger decline in the near term. The next key support is near the $8,650 area and the 55 simple moving average (4-hours).
On the upside, an initial resistance is near the $9,440 and $9,500 levels. If the bulls push the price above the $9,500 barrier, there could be a nasty upward move. In the mentioned case, the bulls are likely to aim a test of the key $10,000 resistance zone.
Looking at the chart, bitcoin price is clearly trading with a positive bias above the $9,300 and $9,160 support levels. Unless there is a break below the $9,000 support, the bulls might attempt more gains in the coming days.
Technical indicators
4 hours MACD – The MACD is currently well in the bullish zone.
4 hours RSI (Relative Strength Index) – The RSI is currently in the overbought zone, with no sign of a downside correction.
Key Support Levels – $9,160 and $9,000.
Key Resistance Levels – $9,440, $9,500 and $10,000.
