
- Bitcoin price declined heavily and broke the $8,000 support against the US Dollar.
- The price traded as low as $7,636 and it is currently correcting higher.
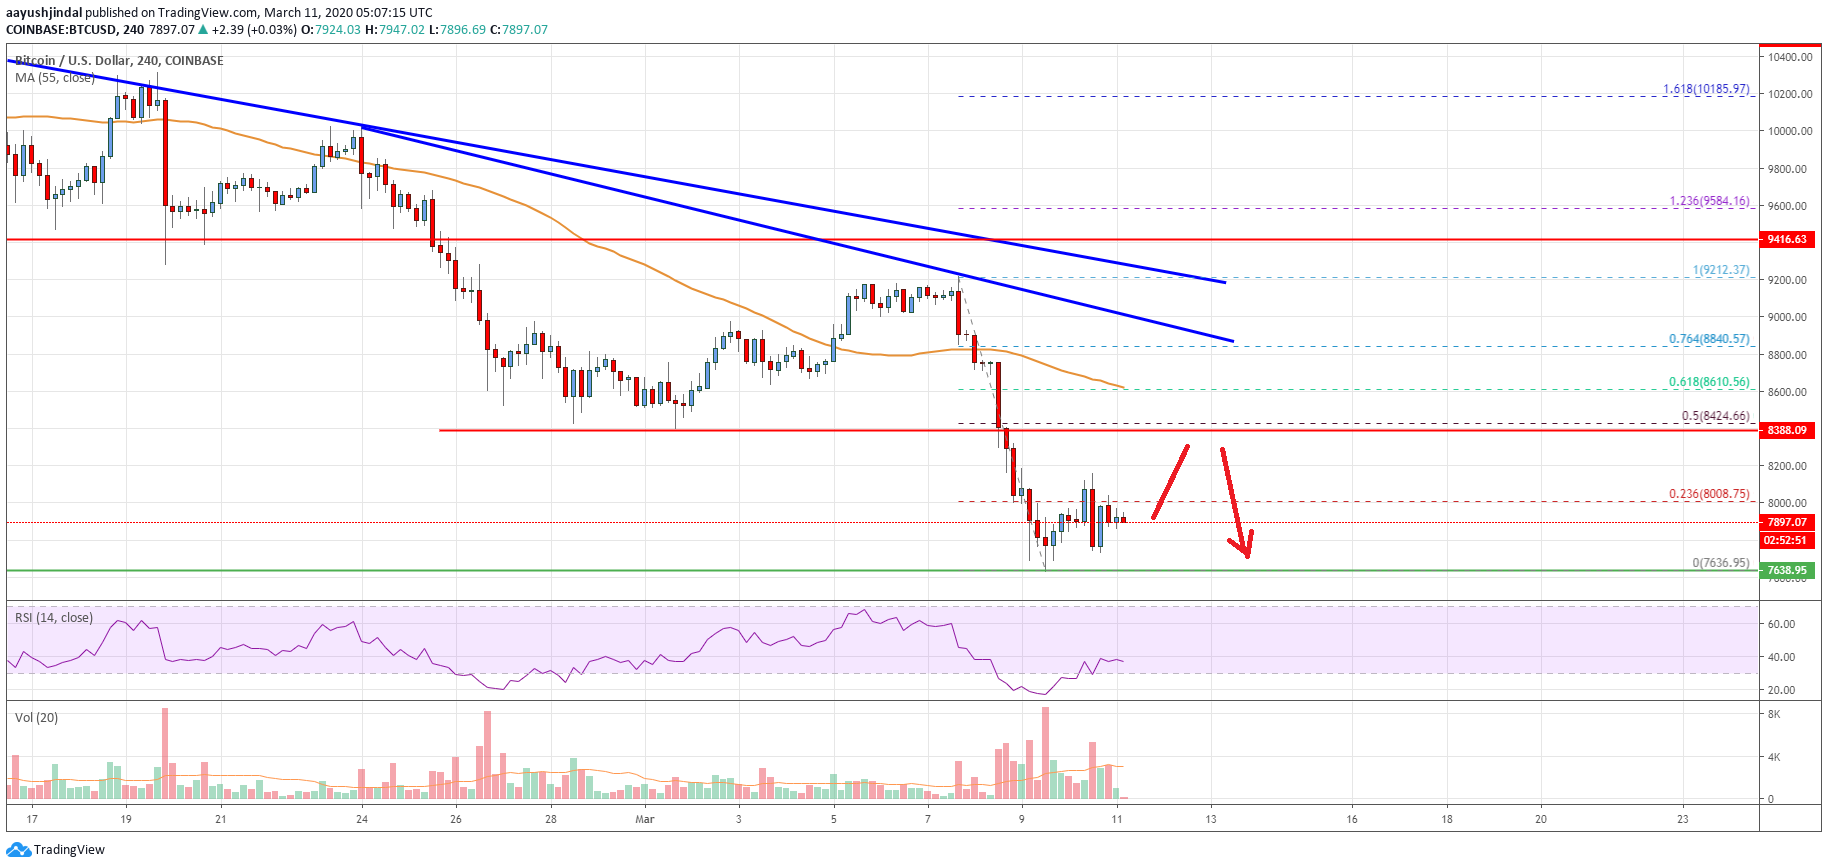
- There are two key bearish trend lines forming with resistance near $8,840 and $9,200 on the 4-hours chart of the BTC/USD pair (data feed from Coinbase).
- The pair could correct higher, but it is likely to face a lot of hurdles near $8,400.
Bitcoin price is trading in a bearish zone below $8,400 against the US Dollar. BTC is likely to correct higher, but upsides are likely to remain capped near $8,200 and $8,400.
Bitcoin Price Analysis
In the past few days, there were steady downsides in bitcoin price below the $8,400 support against the US Dollar. BTC even declined below the $8,200 support and settled well below the 55 simple moving average (4-hours).
Finally, the price spiked below the $8,000 and $7,800 levels. It traded to a new monthly low at $7,636 and it is currently consolidating losses. An initial resistance on the upside is near the $8,000 level.
The 23.6% Fib retracement level of the recent decline from the $9,212 high to $7,636 low is also near the $8,008 level to act as a key hurdle. If the price manages to settle above the $8,000 resistance, it could correct further higher towards the $8,200 area.
The next major hurdle for the bulls is near the $8,400 area (the previous breakdown zone). It is also close to the 50% Fib retracement level of the recent decline from the $9,212 high to $7,636 low.
More importantly, there are two key bearish trend lines forming with resistance near $8,840 and $9,200 on the 4-hours chart of the BTC/USD pair. An intermediate resistance is near $8,610 level and the 55 simple moving average (4-hours).
Therefore, upsides are likely to remain capped in the coming sessions near $8,200 and $8,400. To move into a positive zone, the price must settle above $8,400 and then gain strength above the 55 simple moving average (4-hours).
Conversely, the price might fail to continue above the $8,200 and $8,400 resistance levels. In the mentioned case, it could resume its decline below $7,800 and $7,600.
Looking at the chart, bitcoin price is clearly trading in a bearish zone below $8,400 and it remains at a risk of more losses below $7,800 if it fails to recover above $8,400.
Technical indicators
4 hours MACD – The MACD is slowly moving back into the bullish zone.
4 hours RSI (Relative Strength Index) – The RSI is now recovering and it is just above the 30 level.
Key Support Levels – $7,800 and $7,600.
Key Resistance Levels – $8,000, $8,200 and $8,400.


Leave a Reply
You must be logged in to post a comment.